1. Introduction
The development of technology and information has enabled the public to choose information according to their preferences. This development has resulted in the emergence of numerous online news sites, offering various types of content tailored to specific audience characteristics
| [1] | E. Mitchelstein and P. J. Boczkowski, “Between tradition and change: A review of recent research on online news production,” Journalism, vol. 10, no. 5, pp. 562–586, 2009,
https://doi.org/10.1177/1464884909106533 |
[1]
. Information media influence public attitudes across many aspects of life, including political attitudes. Through the media, public opinion is formed as a benchmark for support or opposition toward political actors
| [2] | B. Siregar, A. Z. Abdullah, and O. Solihin, "Students' Reception to the News of Anies Baswedan as a Presidential Candidate." J. Common, vol. 6, no. 2, pp. 135–145, 2022,
https://doi.org/10.34010/common.v6i2.8476 |
[2]
. The media can shape public attitudes through propaganda disseminated via media exposure.
According to the Indonesia Internet Profile Report 2022 released by the Indonesian Internet Service Providers Association (APJII), internet users in Indonesia reached 210 million people in 2022, accounting for 77.02% of the population. This figure increased from the previous period (73.7% or 196.71 million people), while in 2018 the penetration rate was only 64.8% (171.17 million people)
.
The ICT revolution has provided an opportunity for the government to innovate in public administration through the implementation of the Electronic-Based Government System (SPBE) or E-Government, which refers to the use of ICT to provide services to government agencies, civil servants, businesses, the public, and other stakeholders. SPBE enables open, participative, innovative, and accountable governance, enhancing inter-agency collaboration to achieve common goals
. Digital transformation in the public sector requires more than the mere implementation of technologies, it entails changes in organizational structures, processes, and cultures
. Examples of applications include e-planning, e-budgeting, e-procurement, e-payment, and e-money
.
E-government development in Indonesia does not show a positive trend due to limited contributions from research and development institutions in optimizing implementation
| [7] | F. Masyhur, “e-Government Research in Indonesia: A Systematic Literature Study from the Perspective of Indonesian e-Government Ranking Dimensions (PeGI),” J. IPTEKKOM J. Ilmu Pengetah. Teknol. Inf., vol. 19, no. 1, p. 51, 2017,
https://doi.org/10.33164/iptekkom.19.1.2017.51-62 |
[7]
. There is still a lack of quantitative research related to e-government development in Indonesia. In contrast, Bouty et al. (2019) revealed that the electronic-based governance system in Gorontalo City received a good rating in terms of IT systems. However, improvements are still needed in policy areas such as the SPBE Steering Team, integrated business processes, and system integration. Strengthening governance and inter-agency coordination also needs urgent attention
| [8] | A. A. Bouty, M. H. Koniyo, and D. Novian, “The Evaluation of Electronic Based Government System Using E-Government Maturity Model (Case in Government of Gorontalo City),” Penelit. Komun. dan Opini Publik, vol. 23, no. 1, pp. 16–24, 2019. |
[8]
.
Prior research on SPBE and e-government in Indonesia has primarily focused on technical challenges, IT system readiness, and maturity model evaluations, leaving a significant gap in understanding the discursive and relational dynamics among policy actors. Specifically, existing studies have not examined how actors construct, contest, and disseminate discourse regarding e-government policy through media networks. This gap is particularly significant because coordination failures in digital governance are shaped not only by technical deficiencies but also by ideational conflicts and power asymmetries among stakeholders. The present study addresses this gap by employing DNA to map policy discourse coalitions and actor interactions in Indonesian e-government implementation.
This research uses DNA, which combines qualitative content analysis and network analysis for a more comprehensive investigation. DNA focuses not only on material aspects—such as political actors, institutional resources, and beliefs—but also on ideational aspects, including advocacy coalition frameworks, actor belief systems, policy learning, and coalition formation
.
The overarching goal is to analyze the public debate over e-government policy using DNA, providing insights into communication structures that shape digital governance outcomes.
The scope of public policy studies is broad, covering sectors such as economics, politics, society, culture, and law. In terms of hierarchy, public policy can be national, regional, or local—ranging from laws to government regulations, presidential decrees, ministerial regulations, provincial policies, governor’s decisions, local regulations, and mayoral or regent decisions. Public policy has various definitions depending on the perspective.
Easton defines public policy as "the authoritative allocation of values for the whole society." Lasswell and Kaplan see it as a projected program of goals, values, and practices. Pressman and Wildavsky define it as a hypothesis containing initial conditions and foreseeable consequences. Robert Eyestone describes it as "the relationship between governmental units and their environment." Nugroho identifies two characteristics: (1) public policy is easy to understand—it encompasses actions aimed at achieving national goals, and (2) public policy is measurable—based on how much progress is made in achieving ideals. Woll adds that public policy consists of government activities to solve societal issues either directly or through institutions that influence society
| [10] | Rushananto, “Public Policy,” Kebijak. Publik, no. 1993, p. 15, 2014. |
[10]
.
SPBE/e-government can be defined as the use of ICT to improve efficiency, effectiveness, and transparency in governmental financial and information exchanges. It is a method used by governments to provide services to citizens, enhance government performance, and improve public access to information. SPBE signifies a government commitment to strengthen partnerships between citizens and the public sector. Agencies are increasingly using ICT to improve public services, build relations with business and industry, and enhance internal efficiency. SPBE is expected to reduce corruption, increase transparency, offer more convenience, boost government revenue, and lower costs. Traditionally, public/government interactions took place in government offices, but now services are accessible online. To successfully implement SPBE, governments must use technology as a driver, acknowledge current realities, and increase public participation.
SPBE/e-government services can be classified into 8 types
| [11] | J. R. Gil-García and T. A. Pardo, “E-government success factors: Mapping practical tools to theoretical foundations,” Gov. Inf. Q., vol. 22, no. 2, pp. 187–216, Jan. 2005,
https://doi.org/10.1016/J.GIQ.2005.02.001 |
[11]
: Government-to-Citizen (G2C); Citizen-to-Government (C2G); Government-to-Business (G2B); Business-to-Government (B2G); Government-to-Employee (G2E); Government-to-Government (G2G); Government-to-Nonprofit (G2N); Nonprofit-to-Government (N2G).
Actor Network Theory (ANT) emerged in the 1980s through empirical research by Michel Callon, Bruno Latour, and John Law. ANT sees all elements in the social and natural worlds as effects of interconnected networks. John Law defines ANT in four ways: (1) it is rooted in empirical case studies, (2) it emphasizes relational and material practices, (3) it is not dogmatic, and (4) texts are relational, coming from somewhere and telling stories about networks
| [12] | A. Syakura, “The Policy of Disbanding Hizbut Tahrir Indonesia: A Discourse Network Analysis,” Center for Islamic Boarding School Studies and Community Empowerment, LPPM, Univ. Brawijaya, vol. Vol 3, No, 2021. |
[12]
.
ANT emphasizes relational materiality, where all entities gain significance through relationships. Actors are both human and non-human. Non-human actors include textual, conceptual, social, and technological heterogeneity. Both actor types together form a single reality within actor networks. Networks in ANT are seen as translation processes. Callon identifies four phases in network formation: 1) Problematization – A key actor defines the issue and roles of other actors. 2) Interessement – Attracting attention from other actors. 3) Enrollment – Interested actors delegate, negotiate, and assume roles. 4) Mobilization – The network strengthens and binds tightly, though it remains heterogeneous
| [12] | A. Syakura, “The Policy of Disbanding Hizbut Tahrir Indonesia: A Discourse Network Analysis,” Center for Islamic Boarding School Studies and Community Empowerment, LPPM, Univ. Brawijaya, vol. Vol 3, No, 2021. |
[12]
.
DNA shares ANT’s relational perspective but focuses specifically on discourse. Discourse is closely tied to language studies. In argumentative contexts, language is interpreted subjectively and influenced by the socio-historical conditions of the argument. DNA—as a method that systematically measures policy beliefs and actor discourse using text sources—formats data into policy network analysis, facilitating the analysis of both material policy networks (coordination layer) and ideational networks among the same actors (discursive or political belief subsystem layer)
.
2. Methods
This research is a qualitative, descriptive study using the DNA method developed by Philip Leifeld. This methodology was chosen for its ability to integrate the depth of textual data with the sharpness of network visualization, which is highly relevant for studying complex policy debates in Indonesia
| [13] | G. N. Bakry and F. Ardianto, “Applying Discourse Network Analysis in Journalism Studies : Exploring Digital Transformation Response,” vol. 17, no. 1, 2025. |
[13]
.
This method is multidisciplinary and applied across various fields such as communication, politics, public policy, governance, economics, and more. Discourse network analysis has been developed explicitly to study coalition formation based on congruent policy beliefs and enables an enhanced analysis of actor relationships and the discursive structures that shape policy outcomes
| [14] | S. Schaub, Public contestation over agricultural pollution: a discourse network analysis on narrative strategies in the policy process, vol. 54, no. 4. Springer US, 2021.
https://doi.org/10.1007/s11077-021-09439-x |
[14]
.
Data Collection and Sampling Strategy. The data corpus consisted of straight news articles related to government discourse on SPBE implementation, published between March 1 and June 29, 2024. News portals were selected based on national reach, editorial independence, and indexing in recognized media monitoring databases. The selection criteria for individual articles required that: (1) articles were of the straight news format, as this type is most commonly used to report on policy matters and is compatible with DNA coding protocols; and (2) articles explicitly addressed government discourse on the implementation of the Digital-Based Government System (SPBE). This process yielded a final corpus of 6,274 news articles from approximately 11,144 total data entities.
Coding Protocol and Reliability. The coding process followed a structured protocol in which each statement extracted from the news texts was assigned to a specific actor and coded as either supporting, opposing, or neutral with respect to identified policy concepts (e.g., transparency, inter-agency coordination, cybersecurity). Two independent coders were trained on a sample of 200 articles to establish intercoder reliability. Cohen's kappa coefficient was calculated to verify agreement, with a minimum acceptable threshold of κ = 0.75. Discrepancies were resolved through discussion and revision of the codebook prior to full-scale coding. The coding was conducted using the Discourse Network Analyzer (DNA) software developed by Leifeld, which allows actor-based nested annotation of concept usage and the export of resulting network data for statistical and network analysis.
The DNA method offers a way to integrate these components. Leifeld (2016, 2017) outlines the construction of affiliation networks, actor congruence networks, concept congruence networks, conflict networks, and effective normalization methods for discourse network analysis. This method is implemented through the Discourse Network Analyzer, a qualitative content analysis software that allows actor-based nested annotation of 'concept' usage (broadly understood as the content they discuss, including policy preferences or arguments) and the export of the resulting network data to statistical and network analysis software packages. The resulting networks can be analyzed at the actor level, concept level, or a combined two-mode level, and possibly over time. From a policy network perspective, the actor level is the most interesting: An actor congruence network links two policy actors if both use the same concept—possibly in different situations or documents—in the same way at least once. More specifically, two actors must either jointly support or jointly oppose the same concept in order to be connected.
The more concepts two actors agree on (positively or negatively), the stronger the tie between them, normalized by the average number of concepts used by both actors. This type of network effectively reflects coordination relationships found in policy network studies. Both types of networks are based on actors within the policy domain, and both can reveal coalitions of actors as tightly interconnected subgroups within the network
.
Network Analysis Metrics
Prior to presenting the results of the centrality analysis, the key network metrics employed in this study are defined as follows. Degree Centrality refers to the number of direct connections each actor has. This metric counts the connections both incoming and outgoing for each node, identifying the most prominent actors within the network. Betweenness Centrality measures how often an actor lies on the shortest path between two other actors; actors with high betweenness can be considered information controllers or gatekeepers. Closeness Centrality measures how quickly an actor can reach all other actors in the network. Network Density refers to the proportion of actual connections relative to the maximum possible connections in the network, indicating the overall connectedness of the discourse system. Modularity is a measure used in cluster analysis to assess the strength of the network's division into subgroups or communities. These metrics were computed using standard social network analysis procedures and are presented quantitatively in
Table 1 below.
Table 1. Key Network Metrics for the SPBE Discourse Network (March–June 2024).
Network Metric | Value | Interpretation |
Network Density | 0.14 | Sparse network; information flows concentrated at hubs |
Modularity Score | 0.61 | Strong community structure; distinct discourse coalitions identified |
Degree Centrality (Budi Arie Setiadi) | High (Top 1) | Most-connected actor; primary information hub |
Betweenness Centrality (Budi Arie Setiadi) | High (Top 1) | Key information gatekeeper between clusters |
Closeness Centrality (Budi Arie Setiadi) | High | Fastest reach to all network actors |
3. Results and Discussions
The research data on the implementation of e-government from March 1, 2024, to June 29, 2024, was collected from news portals. There were approximately 11,144 news items from several online media outlets. The News category had the highest number, totaling 6,274, indicating that news is the primary communication channel used in the communication network regarding SPBE policies. These news items likely included reports, articles, and updates on SPBE policies, implementation, and impacts.
There were 1,143 individuals (Persons) involved, showing that individuals such as government officials, experts, academics, and other parties play an important role in this communication network. A total of 1,084 Organizations were involved, which could include government agencies, tech companies, NGOs, and other stakeholders contributing to SPBE development and implementation. The media category had 1,965 mentions, indicating the media's crucial role in disseminating SPBE policy information and education to the public. The media acts as a bridge between the government and the people, ensuring transparency and accountability. Digital transformation becomes visible through dynamic, real-time interactions that reshape how services are delivered and how stakeholders, including media and influencers, engage with public institutions
. There were also 678 Influencers, who are key components in this network. Influencers help spread information, raise awareness, and influence public opinion about SPBE policies via social media and other platforms.
As shown in
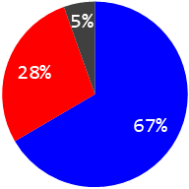
Figure 1, there were 1,547 positive statements, reflecting considerable support or favorable views toward SPBE policies. These statements likely appreciated innovation, efficiency, and service improvements brought about by SPBE. Promoting the positive aspects of SPBE should continue, such as through information campaigns that highlight SPBE’s successes and benefits for the public.
Figure 1. Positive, Neutral, and Negative Sentiment in SPBE News Coverage. Blue represents positive statements, grey represents neutral statements, and orange represents negative statements.
Neutral statements were the highest, totaling 6,506. This indicates that most statements collected were informative or descriptive without emotional or judgmental content—factual reports, announcements, or technical information about SPBE. It is essential that disseminated information remains objective and fact-based to maintain transparency and public trust.
There were 1,766 negative statements, pointing to criticism, concerns, or dissatisfaction regarding SPBE policies. These might include technical issues, implementation obstacles, or public discontent with changes caused by SPBE. Mechanisms should be established to address complaints and criticism constructively—forums, feedback sessions, or using social media for public engagement can be helpful.
The majority of communication around SPBE policies was neutral, indicating a primarily objective spread of information. However, the significant number of positive and negative statements reflects a range of views and reactions from the public and stakeholders. A more in-depth sentiment analysis can help identify trends and patterns in communication around SPBE, supporting more effective, responsive communication strategies.
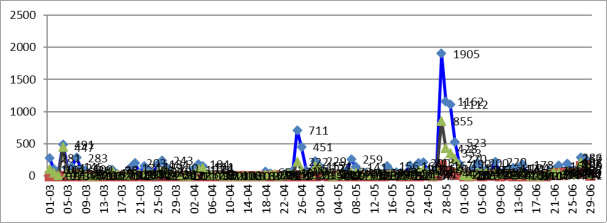
Figure 2. Statements Sentiment Distribution Over Time (March–June 2024).
As illustrated in
Figure 2, there were several significant peaks in news distribution, especially around April 21 and May 28, 2024, with positive news reaching 1,905 items. This suggests that important SPBE-related events or announcements received widespread media attention, with a predominantly positive tone, indicating that the events were well-received by the public and media.
Overall, positive news dominated the SPBE coverage during peak periods, indicating general media and public acceptance of SPBE policies during the analysis period. The distribution graph shows that SPBE policy gained significant media attention at certain points, mostly with a positive tone. To maintain and improve public acceptance, it is important to understand what triggered the news surges, maintain effective communication strategies, and wisely address criticism. Deep, responsive data analysis and sentiment tracking are key to SPBE policy success going forward.
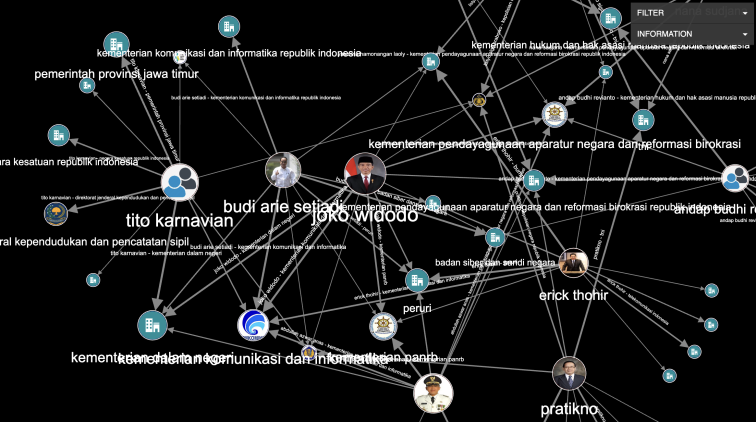
Figure 3. Visualization of the Conceptual Debate Network on E-Government.
Figure 3 illustrates a network graph displaying undirected actor-concept associations, where nodes represent individual actors (labeled by name) and edges represent shared policy positions. Node size reflects degree centrality. Key actors visible in the network include Budi Arie Setiadi, Tito Karnavian, Pratikno, and Abdullah Azwar Anas. The analysis includes: centrality analysis to identify key actors, cluster analysis to examine groups in the network, brokerage and bridge analysis to undertand actors’ roles as connectors, structural hole analysis to assess communication effectiveness, hierarchical and distributed network analysis to understand information flow dynamics, and leadership identification using network indicators.
Centrality Analysis is used to identify key actors. Several individuals stand out in this network, such as Budi Arie Setiadi, Tito Karnavian, Pratikno, and Abdullah Azwar Anas. These actors are connected to multiple other nodes, indicating that they play a central role in this communication network.
Actors like Budi Arie Setiadi and Tito Karnavian appear to be at the center of a dense network, suggesting that they may play a leading role in disseminating information and coordinating matters related to this policy. Budi Arie Setiadi, Tito Karnavian, Pratikno, and Abdullah Azwar Anas are the main actors with numerous connections to others. Their central positions in the network highlight their important role as hubs for information distribution and decision-making.
From a centrality perspective, their highly connected positions indicate that they act as information controllers and primary coordinators. Critical information and policy directives are likely to pass through them before being disseminated to other actors.
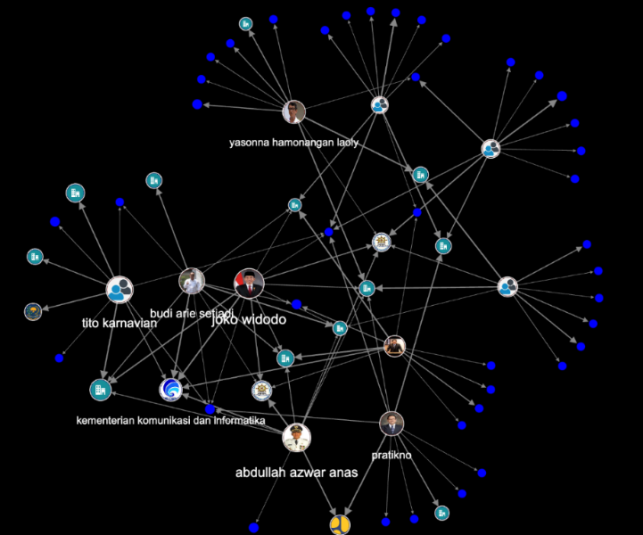
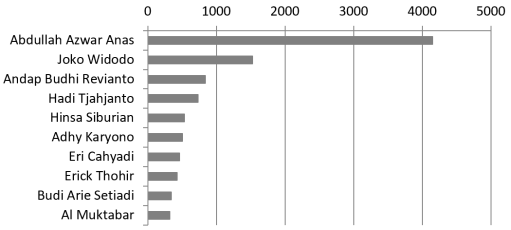
Figure 4. Involved Actors in the SPBE Discourse Network.
Figure 4 presents the actor map showing direct connections between key policy figures and institutional nodes. Identification of Key Actors in the network is used to measure how important or central each actor's position is within the network. In this map, several relevant types of centrality are:
Degree Centrality refers to the number of direct connections each actor has. Degree centrality is a straightforward metric that counts the number of connections both coming into and leaving a node, helping to identify the most prominent nodes within a graph. This calculation involves assessing the node's degree, average degrees, and degree distribution. The degree of a node refers to the total number of direct relationships it has, considering both incoming and outgoing connections
| [15] | A. J. Oroh, Y. Bandung, and L. M. Zagi, “Detection of the Key Actor of Issues Spreading Based on Social Network Analysis in Twitter Social Media,” Proc. - 2021 IEEE Asia Pacific Conf. Wirel. Mobile, APWiMob 2021, pp. 206–212, 2021,
https://doi.org/10.1109/APWiMob51111.2021.9435268 |
[15]
. Actors with high degree centrality (such as Budi Arie Setiadi and Tito Karnavian) serve as communication hubs, indicating that they play an important role in distributing information. In this context, Budi Arie Setiadi has many direct connections, which shows that he functions as an information center.
Betweenness Centrality measures how often an actor lies on the "shortest path" between two other actors. Actors with high betweenness can be considered "information controllers" because they determine communication routes. If Budi Arie Setiadi or Tito Karnavian has high betweenness centrality, they are the main connectors in communication and have significant control over the flow of information.
Closeness Centrality measures how quickly an actor can reach other actors in the network. Actors with high closeness, such as Budi Arie Setiadi, have quick access to all information within the network, making them more effective in coordinating policy.
It can be concluded that Budi Arie Setiadi appears as a highly connected node to other key actors, including prominent figures such as Tito Karnavian and relevant ministries, namely the Ministry of Communication and Information Technology. This position places him at the center of the network, indicating that he plays a crucial role in the flow of information.
Cluster Analysis. This analysis is used to identify groups within the network and examine sub-networks or communities that may form within the main network. This network structure shows a pattern of relationships that is highly concentrated at several central points (central nodes). The network is shaped like a hub-and-spoke or "spider-web" pattern, where central actors act as the main connectors among many other actors. These relationships suggest that information or instructions are likely to flow from these central actors to the others, reflecting a hierarchical network. This is common in government-based communication networks, where a few key leaders or officials regulate the flow of information.
Key actors located in the center of the network not only serve as the center in terms of communication but also function as bridges between several sub-networks or groups of other actors. For example, Budi Arie Setiadi has a direct connection to Tito Karnavian and the Ministry of Communications, positioning him as a bridge between government agencies and individuals. Brokerage analysis in social networks shows that actors who function as bridges have the ability to control the flow of information between groups, which can strengthen their bargaining position in policy processes.
The direct connection between Budi Arie Setiadi and the ministry responsible for communication and information (in this case, the Ministry of Communication and Information) indicates that he may serve as the primary connector in cross-ministerial coordination. This strengthens his role as a leader in policies requiring inter-agency communication integration.
Cluster analysis is used to examine sub-networks or communities that may form within the main network. In this map, it appears that several sub-clusters are connected to key actors: 1) Ministry Sub-cluster: Actors like the Ministry of Communication and Information seem to have related groups, which likely include members with administrative or technical roles in policy. 2) Government Actor Cluster: Actors like Budi Arie Setiadi and Tito Karnavian are closely grouped with several other actors, possibly indicating that they work as a core team in decision-making and policy dissemination.
The formation of clusters allows for more efficient information flow within these groups. However, without strong cross-cluster connections, information may become concentrated in the core group, which could lead to information isolation in the more peripheral parts of the network.
Figure 5. Network Groups in the SPBE Discourse Network.
Figure 5 illustrates the undirected network graph, where nodes represent actors and edges represent shared policy positions. Distinct colored clusters represent community groupings identified through modularity optimization. Brokerage and Bridge Analysis to understand the position of actors as connectors. This gap could be a physical one, like geographic distance, or it could be a cognitive or cultural gap, such as differences in disciplines or professions. Alternatively, the gap may arise from a lack of trust between the parties involved
| [16] | J. C. Long, F. C. Cunningham, and J. Braithwaite, “Bridges, brokers and boundary spanners in collaborative networks: A systematic review,” BMC Health Serv. Res., vol. 13, no. 1, 2013, https://doi.org/10.1186/1472-6963-13-158 |
[16]
. This network shows a hierarchical structure with several main hubs directing communication to peripheral actors. This structure aligns with the communication pattern in government organizations, which are often hierarchical and layered. This hierarchical structure allows for efficient communication from the center to the periphery but carries the risk of bottlenecks or communication flow obstacles if key actors fail to perform their roles, such as in cases of political or administrative changes.
Budi Arie Setiadi not only occupies the center but also has relationships resembling a hub-and-spoke pattern with more peripheral actors. This pattern is commonly found in leadership structures, where a leader acts as the organizer of information flowing from the center to all sides of the network. Brokerage or the role of an intermediary is crucial in government networks, as policies often require inter-agency coordination. In this network, actors like Budi Arie Setiadi and Tito Karnavian likely play roles as brokers or connectors between groups. Actors in a bridge role connect different clusters, enabling cross-group communication. For example, if Budi Arie Setiadi connects ministries with other groups of actors, he plays a key role as a cross-cluster connector. As brokers, they have significant influence in determining how information flows between clusters and how policies are translated and applied at different levels.
It is apparent that ministries or agencies are also part of this network, such as the Ministry of Communication and Information. This indicates the ministry's involvement in the policy and its potential role as the main facilitator in implementing the electronic government system. The ministry's actors are connected with several other key actors, suggesting collaborative relationships between government agencies to support this policy.
Figure 6. Visualization of the SPBE Communication Network.
As shown in
Figure 6, structural Hole Analysis to Assess Communication Effectiveness. Structural holes refer to gaps between two actors or groups within a network that do not have direct connections. Actors positioned within these gaps can play a crucial role as gatekeepers or boundary spanners, uniting information from both sides. These actors serve as gap fillers. An actor who occupies a structural hole, such as Budi Arie Setiadi, can gain a competitive advantage by having exclusive access to information from both sides of the gap.
Additionally, these actors are key to Communication Effectiveness. Those who bridge structural holes help reduce information redundancy and foster innovation within the network, as they connect groups that may hold differing or complementary perspectives.
However, if the network becomes overly dependent on a few central nodes (e.g., Budi Arie Setiadi and Tito Karnavian), communication bottlenecks may arise when one of these key actors is unavailable. Peripheral actors may have limited access to direct information, potentially slowing down the policy implementation process.
Therefore, the network structure should be carefully managed to ensure that information flows not only from key actors to others but also creates more direct, reciprocal relationships among all actors. The Ministry of Communication and Informatics, which maintains several connections with key actors, appears to serve as a primary facilitator within this network. Its position indicates that the ministry is responsible for ensuring both technical and administrative coordination in the implementation of the electronic-based government system. The ministry’s role as a connector between individual actors and other institutions places it in a strategic position to facilitate interoperability across various government systems and procedures.
Hierarchical and Distributed Network Analysis is used to understand the dynamics of information flow. This map illustrates a network that tends to be hierarchical, with several key actors (such as Budi Arie Setiadi and Tito Karnavian) managing communication with other actors. This structure is commonly found in government organizations that operate under a decision-making hierarchy. Communication efficiency is evident as such hierarchical networks facilitate the top-down distribution of information. However, this can also become a weakness due to excessive reliance on a few main actors, which, if disrupted, can cause communication bottlenecks. An alternative distributed network is more suitable for policies that require flexibility and rapid adaptation, as a distributed network may be more effective. In a distributed network, each actor has direct connections with more actors, which increases the speed of information flow and reduces dependence on one or two central actors.
Dependence on several central actors can create communication bottlenecks. For example, if one of the key actors such as Budi Arie Setiadi or Tito Karnavian is unable to function optimally, the flow of information may be disrupted. In the context of digital policy, this could lead to delays in policy implementation or even miscommunication, as information might not be disseminated quickly throughout the network. Based on the analysis conducted, Budi Arie Setiadi is a strong candidate to lead this network due to his high degree centrality, which indicates he has direct connections with many other actors, granting him broad access and control over the flow of information. With his strategic position as a connector, he can manage the distribution of information among different groups. His direct relationship with the Ministry of Communication and Informatics suggests that he holds a key position in coordinating this policy across institutions.
To improve communication effectiveness, the network can be expanded by increasing direct connectivity between peripheral actors and other central nodes besides the existing key actors. This would create redundancy and reduce reliance on a few key individuals. Additionally, building more cross-links between several actors outside the network’s center can enhance information dissemination and minimize the risk of stagnation if one of the central actors faces communication obstacles. In the context of electronic-based government system policy, these central actors are likely individuals or institutions that play decision-making roles or serve as communication mediators between the central government and relevant agencies. Their role as primary connectors highlights their importance in ensuring the successful implementation of the policy. This tightly connected network structure is crucial for accelerating the communication process in digital policy contexts, but it must also be balanced with communication policies that ensure information is evenly distributed among all involved actors. Communication network analysis shows that Budi Arie Setiadi serves as the main leader in this electronic-based government policy. He occupies a central position with direct connections to other key actors and related ministries, enabling him to control the flow of information and coordinate policy implementation. This hierarchical network structure is effective for formal communication but requires the addition of cross-group connections to avoid potential communication bottlenecks. Overall, this network map indicates the importance of central roles and information distribution in implementing electronic-based policies and suggests that improvements in distribution and cross-cluster communication networks can further enhance the efficiency of policy execution.
To ensure the successful implementation of this policy, a strong communication network is required among all actors involved. Recommended strategies to strengthen the communication network include: 1) Redundancy and Multi-layered Connectivity: Increasing cross-connections among peripheral actors can enhance redundancy, thereby reducing dependency on a few central actors. 2) Increased Autonomy for Working Groups: Granting greater autonomy to small groups or sub-clusters allows them to make decisions or disseminate information without having to go through central actors, thereby speeding up communication processes. 3) Transparency in Information Flow: Enhancing transparency in information flow among key actors can improve communication effectiveness and reduce the risk of bottlenecks.