Abstract
Heart disease is the abnormal health condition that influences parts of the heart and all its parts. World Health Organization (WHO) is assured that the disease is one of the leading killer disease of the worldwide population. The prevalence of the disease is also increasing through developing countries like Ethiopia. Machine Learning (ML) is one of the key technique in the management and processing of a huge number of health data’s and it supports in diagnosis and prediction of disease at early stages. The main objective of this study is developing an early detection of Heart Disease (HD) enhancing prediction through ML technique; such as Random forest (RF), K Nearest Neighbor (KNN), Support vector Machine (SVM), Gradient Boosting (GB) and Voting Classifier with two Feature Selection (FS) methods, of Chi-Square (CFS) and Sequential Forward Feature Selection (SFFS) methods. The data used for the experimentation purpose was collected from Local Hospitals. Before FS methods are performed, all the ML algorithms are applied for the imbalanced and balanced HD dataset. Then after, the two FS methods are applied with ML techniques on these imbalanced and balanced datasets. Models are evaluated through different model evaluation metrics with two data splitting technique namely Percentage Splitting (PS) and 10-Fold-Cross Validation (10-F-CV) techniques and finally different results are registered. Thus, before FS methods are applied on the full balanced datasets, SVM and GB achieved a good accuracy score of 99.2% using PS and similarly after FS technique is applied, Both RF with CFS and VC with CFS achieved a better accuracy score of 99.4% using PS for the combined dataset, so this will helps users and experts to detect and appropriate prevention of the disease at an early stage.
|
Published in
|
Science Research (Volume 14, Issue 2)
|
|
DOI
|
10.11648/j.sr.20261402.12
|
|
Page(s)
|
28-41 |
|
Creative Commons
|

This is an Open Access article, distributed under the terms of the Creative Commons Attribution 4.0 International License (http://creativecommons.org/licenses/by/4.0/), which permits unrestricted use, distribution and reproduction in any medium or format, provided the original work is properly cited.
|
|
Copyright
|
Copyright © The Author(s), 2026. Published by Science Publishing Group
|
Keywords
Chi-square Feature Selection, Heart Disease Detection, Machine Learning
1. Introduction
The heart is the most important organ of the human body because it pumps blood and circulates to the entire body
| [1] | Yash Jayesh Chauhan, “Cardiovascular Disease Prediction using Classification Algorithms of Machine Learning,” Int. J. Sci. Res., vol. Volume 9, no. Isuue 5 May, pp. 194–200, 2020, https://doi.org/10.21275/SR20501193934 |
[1]
. This organ could be exposed to different conditions or diseases. Thus, the word Heart disease refers to a broad range of illnesses. These medical conditions refer to the pathological states that directly affect the heart and all of its components. In every days life of human being Heart Disease (HD) is the main cause of death in the whole world. World Health Organization (WHO) predicted that at least 12 million deaths occurred worldwide. In every year due to HD greater than 80% of deaths occurred in the world. WHO predicted that in future almost 23.6 million peoples will die because of HD and stroke related disease by 2030
| [2] | K. Vembandasamy, R. Sasipriya, and E. Deepa, “Heart Diseases Detection Using Naive Bayes Algorithm,” Int. J. Innov. Sci. Eng. Technol., vol. 2, no. 9, pp. 441–444, 2015. |
| [3] | M. N. Uddin and R. K. Halder, “An ensemble method based multilayer dynamic system to predict cardiovascular disease using machine learning approach,” Informatics Med. Unlocked, vol. 24, p. 100584, 2021,
https://doi.org/10.1016/j.imu.2021.100584 |
[2, 3]
. HD is a common deadly condition and it current the number one killer disease of the global population.
The other report of WHO states that cardiovascular (CVD) kills 17.9 million peoples every year accounting for about 32% of the world death. This report also states that HD and stroke are the leading causes of CVD accounting about an approximate number of 85% of deaths, where the age of the people was under 70 and accounting one-third of all premature deaths
| [3] | M. N. Uddin and R. K. Halder, “An ensemble method based multilayer dynamic system to predict cardiovascular disease using machine learning approach,” Informatics Med. Unlocked, vol. 24, p. 100584, 2021,
https://doi.org/10.1016/j.imu.2021.100584 |
[3]
. This report also states that, 17.3 million deaths caused by HD in 2008, approximately 6.2 million were due to stroke, and predicted that 7.3 million people deaths were due to coronary heart disease (CHD).
Another report shows that almost one-third of the population of the world were died in developing countries in 2010
. Additional report in
| [5] | D. A. Angaw, R. Ali, A. Tadele, and S. Shumet, “The prevalence of cardiovascular disease in Ethiopia : a systematic review and meta - analysis of institutional and community - based studies,” pp. 1–9, 2021,
https://doi.org/10.1186/s12872-020-01828-z |
[5]
states that Cancer, Chronic respiratory Disease, CVD and Diabetes mellitus diseases are on increasing and the leading risks of human health and development. These causes accounts around 35 million deaths each year and 85% are in developing countries including Ethiopia
| [5] | D. A. Angaw, R. Ali, A. Tadele, and S. Shumet, “The prevalence of cardiovascular disease in Ethiopia : a systematic review and meta - analysis of institutional and community - based studies,” pp. 1–9, 2021,
https://doi.org/10.1186/s12872-020-01828-z |
[5]
. WHO additionally reported that, in 2014, around 30% of the people of Ethiopia are died due Non-Communicable Diseases (NCD) of which CVD contributes 9%
| [5] | D. A. Angaw, R. Ali, A. Tadele, and S. Shumet, “The prevalence of cardiovascular disease in Ethiopia : a systematic review and meta - analysis of institutional and community - based studies,” pp. 1–9, 2021,
https://doi.org/10.1186/s12872-020-01828-z |
[5]
.
Another study from 2021 indicates that the primary causes of CVD deaths in Ethiopia were various forms of HD, with approximately 170 Ethiopians dying every day. Ischemic heart disease (IHD) accounted for 45% of these deaths, heart stroke for 34% and hypertensive HD for approximately 11%
| [6] | D. Yadeta, W. Walelgne, J. M. Fourie, W. Scholtz, O. Scarlatescu, and G. Nel, “Cardiovascular Topics Ethiopia Country Report PASCAR and WHF Cardiovascular Diseases Scorecard project,” vol. 32, no. 1, pp. 37–46, 2021,
https://doi.org/10.5830/CVJA-2021-001 |
[6]
. All the reports of these studies shows that the prevalence of HD in Ethiopia is highly increasing with respect to the prevalence of the disease around the world. Similar to diseases of the circulatory system, high blood pressure, smoking, diabetes, and physical inactivity are just a few of the numerous causes of CVD, which includes HD. Up until now, research has always been concentrated on strategies to lower the number of deaths from cardiac related illnesses. However, Approximately 90% of cardiac related illnesses can be prevented, according to studies
| [7] | D. Zhang et al., “Heart Disease Prediction Based on the Embedded Feature Selection Method and Deep Neural Network,” vol. 2021, no. Ml, 2021,
https://doi.org/10.1155/2021/6260022 Research. |
| [8] | C. B. C. Latha and S. C. Jeeva, “Improving the accuracy of prediction of heart disease risk based on ensemble classification techniques,” Informatics Med. Unlocked, vol. 16, no. July, p. 100203, 2019, https://doi.org/10.1016/j.imu.2019.100203 |
[7, 8]
.
As we know, any medical conditions or any disease have its own risk factors, so cardio vascular disease including heart disease also have its own risk factors. These includes age, Sex, smoking family history, poor-diet, cholesterol level, High blood pressure, physical inactivity, obesity and alcohol are considered to be the risk factors for heart disease (HD) and other hereditary risk factors such as high blood pressure and diabetes had leads to heart disease, however, some of the risk factors are controllable
| [8] | C. B. C. Latha and S. C. Jeeva, “Improving the accuracy of prediction of heart disease risk based on ensemble classification techniques,” Informatics Med. Unlocked, vol. 16, no. July, p. 100203, 2019, https://doi.org/10.1016/j.imu.2019.100203 |
[8]
. Heart disease has a wide range of symptoms; some may experience weariness or fatigue and chest discomfort, while nearly 50% of people have no symptoms at all until they have a heart attack.
The goal of Machine learning (ML), a branch of research that lies at the nexus of computer science, artificial intelligence (AI), and statistics, is to extract knowledge from data. ML is sometimes referred to as statistical learning or predictive analytics
| [10] | S. and A. C. M. Guido, Introduction to Machine Learning with Python, ISBN- 9352134575, 9789352134571, O'Reilly Media, Incorporated, 2018, 2016. |
[10]
. Thus, the primary objective of ML is teaching machines or computers to complete undertaking tasks by giving them several models with the idea of how to do or not complete a certain tasks
| [11] | W. Richert and L. P. Coelho, Building Machine Learning Systems with Python, 271 pages, 2013. |
[11]
. One of the common application of this field is the prediction of an outcome based upon existing data
| [10] | S. and A. C. M. Guido, Introduction to Machine Learning with Python, ISBN- 9352134575, 9789352134571, O'Reilly Media, Incorporated, 2018, 2016. |
[10]
.
Various ML algorithms like Logistic Regression (LR), Naive Bayes (NB), Support Vector Machine (SVM), K Nearest Neighbor (KNN), Decision Tree (DT), Random Forest (RF) and Ensemble technique XG Boost. Compared to finding the most accurate model
| [12] | H. E. Taye and A. Science, “MACHINE LEARNING BASED CHRONIC KIDNEY DISEASE PREDICTION MODEL Adama, Ethiopia,” 2021. |
| [26] | A. Garg, B. Sharma, and R. Khan, “Heart disease prediction using machine learning techniques,” IOP Conf. Ser. Mater. Sci. Eng., vol. 1022, no. 1, 2021,
https://doi.org/10.1088/1757-899X/1022/1/012046 |
[12, 26]
. In the medical field, ML can be used to diagnose, detect and predict various diseases
| [13] | S. D. D. Kriti Gandhi, Mansi Mittal, Neha Gupta, “Disease Prediction using Machine Learning,” Int. J. Res. Appl. Sci. Eng. Technol. ijraset Cite, vol. 8, no. June 2020, VI, pp. 1–12, 2022, https://doi.org/10.22214/ijraset.2020.6077 |
[13]
. According to reports, machine learning (ML) is a rapidly expanding field in the medical diagnosis sector, where computer analysis can reduce manual error and improve accuracy. With computer and machine learning techniques, the diagnosis of a disease is extremely reliable. ML concepts are used to predict diseases like diabetes, liver disease, heart disease, and tumors.
ML can be supervised ML, Unsupervised ML, Semi supervised ML, Ensemble learning and Reinforcement learning. This field is becoming a very interesting and applicable research area in the fields of medication and health sectors in several disease prediction and detection using patient history data with a highly performing classifier. Predictive analysis with the help of efficient and numerous ML techniques helps to predict the disease faster, accurately and correctly helping in treating of patients within a few second and reduce waiting time
| [13] | S. D. D. Kriti Gandhi, Mansi Mittal, Neha Gupta, “Disease Prediction using Machine Learning,” Int. J. Res. Appl. Sci. Eng. Technol. ijraset Cite, vol. 8, no. June 2020, VI, pp. 1–12, 2022, https://doi.org/10.22214/ijraset.2020.6077 |
[13]
.
Nowadays, the majority of medical diagnoses and treatments in Ethiopia are using antiquated or traditional laboratory testing and ineffective healthcare systems that manually process and produce clinical trials' outcomes
| [15] | S. N. Kassaye, K. Kakeba, B. G. Ieee-member, and A. Dessie, “Rheumatic Heart Disease Detection Using Machine Learning Techniques,” 2021, pp. 1–20. |
[15]
. Because of this, it is quite uncommon in Ethiopia to be able to access prompt and trustworthy medical care. In developing countries like Ethiopia early prevention of disease is almost none because of lack of medical resources
| [14] | Dibaba Adeba Debal, “Chronic Kidney Disease Prediction Using Machine Learning Techniques, Adama, Ethiopia,” 2021. |
[14]
, lack of health professionals specialized on that fields, lack of early diagnosis and treatment ordering and also lack of heart disease predicting tools helping the health care experts. According to a number of recent researches to overcome such limitations, ML approaches have demonstrated promising outcomes in the diagnosis and detection of cardiac conditions
| [15] | S. N. Kassaye, K. Kakeba, B. G. Ieee-member, and A. Dessie, “Rheumatic Heart Disease Detection Using Machine Learning Techniques,” 2021, pp. 1–20. |
[15]
and other various diseases
| [13] | S. D. D. Kriti Gandhi, Mansi Mittal, Neha Gupta, “Disease Prediction using Machine Learning,” Int. J. Res. Appl. Sci. Eng. Technol. ijraset Cite, vol. 8, no. June 2020, VI, pp. 1–12, 2022, https://doi.org/10.22214/ijraset.2020.6077 |
[13]
, Specifically, complex nonlinear relationships can be learned from the training datasets using supervised learning approaches and algorithms and these algorithms are also comparing in different areas such as disease diagnosis, detection or prediction and finds the most accurate models
| [12] | H. E. Taye and A. Science, “MACHINE LEARNING BASED CHRONIC KIDNEY DISEASE PREDICTION MODEL Adama, Ethiopia,” 2021. |
[12]
.
However, as it is observed in different research works, no local HD datasets was included in various research works and the performance they achieved using these algorithms with FS methods is not that much good. In addition to this, certain supervised ML and EL algorithms have demonstrated diagnostic and predictive accuracy in health care areas that surpasses of highly skilled medical professionals. However, as noted in
| [14] | Dibaba Adeba Debal, “Chronic Kidney Disease Prediction Using Machine Learning Techniques, Adama, Ethiopia,” 2021. |
[14]
and
| [15] | S. N. Kassaye, K. Kakeba, B. G. Ieee-member, and A. Dessie, “Rheumatic Heart Disease Detection Using Machine Learning Techniques,” 2021, pp. 1–20. |
[15]
, very few studies have been done on the application of ML for the prediction of HD in Ethiopia for a variety of reasons, including a lack of local and suitably configured datasets
| [15] | S. N. Kassaye, K. Kakeba, B. G. Ieee-member, and A. Dessie, “Rheumatic Heart Disease Detection Using Machine Learning Techniques,” 2021, pp. 1–20. |
[15]
.
In other way, various risk factors are also linked to HD, so early detection of the diseases risk factor is very crucial for prompt management of the disease, necessitating the use of accurate, dependable, and reasonable approaches
. When a favorable feature combination is also missing or the algorithms are not used appropriately, the effectiveness of ML algorithms used for CVD prediction is also greatly reduced. Thus, finding the crucial feature combination method that works best with the top-performing algorithm is therefore crucial
| [19] | M. S. Amin, Y. K. Chiam, and K. D. Varathan, “Identification of significant features and data mining techniques in predicting heart disease,” Telemat. Informatics, 2018,
https://doi.org/10.1016/j.tele.2018.11.007 |
[19]
. Therefore, quick and efficient methods for HD detection and prediction methods are needed to reduce death and disability from heart disease. This is especially important in poor nations like Ethiopia, where there is a dearth of cardiac specialists and a high prevalence of the disease with incorrect diagnoses. Therefore, by learning about the condition from patient data, ML can be a useful tool to help doctors diagnosing the disease. Thus, creating and building ML model that can identify and forecast HD at an early stage is necessary. The proposed ML technique can support physicians to reduce the difficulties, bias as well as other related burdens of medical diagnosis. In general, the contributions of this work is developing a reliable model for early detection of HD; enhancing prediction performance through different supervised and Ensemble ML techniques with two different FS methods, this can help for the identification of the better ML model with the most informative features for the prediction of HD through the given locally configure datasets. This will supports health care physicians and ill patients in timely detection of the disease and helps in ordering treatments early in accurate and reliable manner.
2. Materials and Methods
The data to conduct the proposed study was collected from local health institutions found in Ethiopia, specially Wolkite University Teaching and Referral Hospital (WKUTRH). The hospital launched giving service for the near community starting from 2012 until now and gives service for the near community in different fields of cases such as CVD inpatient and outpatient cases including different HD conditions. The data collected here are secondary patient record data’s which are collected without direct communication with the patient. In order to consider different features to predict the presence or absence of HD, interviewing some of the concerning health experts was the main tools for the data collection.
The datasets are prepared in the form of CSV (comma separated values) format in order to make the data appropriate for machine readable in python programming language plate form. Thus, this dataset was configured in to standard format with an instances 774 with 14 main features including 1 target categorical value. Those datasets contains their own categorical and numerical or continuous features with the mentioned target class. Those 14 features includes age, sex, chest pain type (Cp), resting blood pressure (Trestbp), serum cholesterol (Chol), fasting blood sugar (Fbs), resting Eco-cardio graphic results (restecg), maximum heart rate achieved (thalach), exercise induced angina (Exang), ST depression exercise (Oldpeak), slope of the peak exercise ST segments (Slope), number of major vessels colored by fluoroscopy (Ca), types of defects (thal) and the target class attribute. The description of these features are shown as
Table 1 below.
Table 1. Description of Heart Disease Dataset.
No | Attribute name | Description of features (attributes name) | Range of Datasets | Type of the attribute |
1. | Age | Age of the person in years | 7 to 100 | Numeric |
2. | Sex | Gender of the person having 1= Male, 0 = Female | 0, 1 | Categorical |
3. | Cp | Chest pain Type having 0=Typical angina, 1=atypical angina, 2=non-angina pain, 3=asymptomatic | 0, 1, 2, 3 | Categorical |
4. | Trestbps | Resting Blood Pressure in mm Hg | 17 to 225 | Numeric |
5. | Chol | Serum Cholesterol in mg/dl | 126 to 564 | Numeric |
6. | Fbs | Fasting Blood Sugar in mg/dl | 0, 1 | Categorical |
7. | RestEcg | Resting Echocardiographic Results | 0, 1 | Categorical |
8. | Thalach | Maximum Heart rate Achieved | 40 to 202 | Numeric |
9. | Exang | Exercise Induced Angina | 0, 1 | Categorical |
10. | Oldpeak | ST Depression induced by Exercise | 0 to 6.2 | Numeric |
11. | Slope | Slope of the peak Exercise ST segment | 0, 1, 2 | Categorical |
12. | Ca | Number of Major Vessels Colored by Fluoroscopy | 0 to 3 | Numeric |
13. | Thal | Defect Type having 0= normal, 1= Fixed defect, 2= Reversible defect and 3=non reversible defect | 0, 1, 2, 3 | Categorical |
14. | Target | The binary target class attribute | 0 or 1 | Categorical |
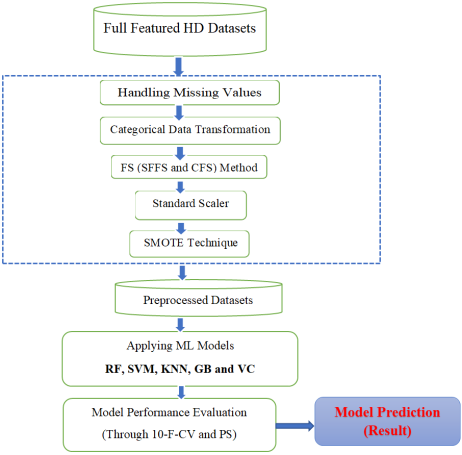
2.1. Architecture of Heart Disease Prediction Model
After the collection and proper configuration of the local HD datasets to get the most relevant feature for the prediction of HD, the model was developed using five different ML algorithms namely KNN, SVM, RF, GB and VC and also different evaluation metrics are compared. The overall architecture of the proposed HD prediction model is shown in the
Figure 1 below.
Figure 1. The proposed heart disease prediction architecture.
2.2. Data Preprocessing
Data is the most important parts in ML, AI and data analysis
| [1] | Yash Jayesh Chauhan, “Cardiovascular Disease Prediction using Classification Algorithms of Machine Learning,” Int. J. Sci. Res., vol. Volume 9, no. Isuue 5 May, pp. 194–200, 2020, https://doi.org/10.21275/SR20501193934 |
[1]
. Data can have several issues in every day’s activity such as missing values, outliers, categorical and numerical values in a mixed formats. Thus, after datasets was collected and prepared, data preprocessing methods such as noisy data cleaning, handling missing values, handling categorical data and FS methods have been done to get a very clean and correct datasets to get better early detection and predicting HD ML model.
2.2.1. Noisy Data Cleaning
Noisy data or outliers cleaning was appropriately done in the data preprocessing section because cleaning noisy data or outlier is a crucial part in data preprocessing step before the process of model building phase.
2.2.2. Handling Missing Values
Some datasets can have their own missing values through different cases such writing important diagnostic information in easy hand writing format
| [12] | H. E. Taye and A. Science, “MACHINE LEARNING BASED CHRONIC KIDNEY DISEASE PREDICTION MODEL Adama, Ethiopia,” 2021. |
[12]
or missed through the case of privacy purpose or missed by the case of missing on the data base. Thus, handling missing values was performed for the datasets and unfortunately those datasets has no missing values.
2.2.3. Handling Categorical Data
Here, converting all the nominal data in to numerical format using dummy variables encoding was done, to transform data’s that exists in different format in to machine understandable and required format such as categorical data transform in to numerical data format. In this case, ‘sex’ having a categorical or nominal values of ‘male’=1 and ‘female’=0, ‘chest pain type’ having values of ‘typical’=0, ‘atypical’=1, ‘non-angina pain’=2 and ‘asymptomatic’=3, ‘Fasting Blood Sugar’ having nominal values of 1=’True’ and 0=’False’, ‘Exercise Induced Angina’ having a categorical values of 1=’yes’ and 0=’no’, ‘Number of major blood vessels’ having a categorical values of ‘0-3’, ’thal’ or ‘defect type’ having a value 0=’normal’ or 1=’fixed defect’ or 2=’reversible defect’, 3=’non-reversible defect’ and the last one is the ‘target’ having values 1=’diseased’ and 2=’not diseased’.
2.2.4. Data Resampling
The most common data resampling technique named as SMOTE (Synthetic Minority Over Sampling Technique) was applied to balance the class distribution of instances, to reduce biases and over fitting that happens in the case of majority data classes.
2.2.5. Feature Scaling
Feature scaling has been performed to make standardize the non-dependent variables of the datasets in to a specified range, i.e. in range between [-1 and 1]. All the numerical features put in to the same scale and same range, to handle a variable dominates on other variable. The standardization equation of feature scaling is shown in equation (
1) below:
The standard feature scaling equation
Where, X′ = New Value
X = Original Value
Mean (x) = Mean Value
a = Standard Deviation
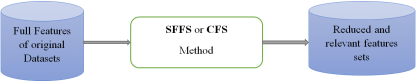
2.3. Feature Selection Method
The main goal behind FS method is minimizing the dimensionality of the features or attributes and maximize the performance of prediction and prevents over fitting
| [14] | Dibaba Adeba Debal, “Chronic Kidney Disease Prediction Using Machine Learning Techniques, Adama, Ethiopia,” 2021. |
| [23] | U. F. Njoku and A. Abelló, “Impact of filter feature selection on classification : an empirical study,” vol. 3130, 2022. |
| [24] | Y. B. Wah, Ibrahim, Nurain, and H. A. Hamid, “Feature selection methods : Case of filter and wrapper approaches for maximising classification accuracy, SCIENCE & TECHNOLOGY, ISSN 0128-7680 e-ISSN 2231-8526, January, 2018. |
| [25] | V. Verma, “A comprehensive guide to Feature Selection using Wrapper methods in Python,” 2020. |
[14, 23-25]
. Here, two FS method i.e. SFFS and Chi-Square method was performed. The FS flow diagram for the prediction of HD shows in the
Figure 2 below.
Figure 2. The feature selection flow diagram.
1). Sequential Forward Feature Selection (SFFS): - is one of the FS method, applied to select features from an empty set of features to all other feature sets in a specified dataset iteratively to add features iteratively in order to check weather accuracy is improved or not. This procedure was go on until new features are added to check weather enhance the developed model's performance. The performance of each added features are evaluated using PS and CV method.
2). Chi-Square Feature Selection (CFS):- CFS method was the second applied FS method which works by selecting the best features based on the univariate statistical tests (Chi-square method). In this process CF among the features and the target variable can be observed through the existence of relationship between features.
3. Machine Learning Model Building
The model building stage of the proposed study shows the early detection and prediction of HD using ML technique and FS method based on already classified or categorized data. These ML algorithms include classification techniques such as KNN and SVM and other EL techniques such as RF, VC and GB algorithms, considering a combination of SFFS and CFS method, through different performance evaluation metrics. All these ML classification and EL algorithms are chosen in order to get better model development for the prediction of HD datasets. These algorithms were popular in some of the previous works such as in
| [17] | S. Mohan, C. Thirumalai, and G. Srivastava, “Effective Heart Disease Prediction using Hybrid Machine Learning Techniques,” IEEE Access, vol. PP, p. 1, 2019,
https://doi.org/10.1109/ACCESS.2019.2923707 |
| [21] | D. Shah, S. Patel, and S. Kumar, “Heart Disease Prediction using Machine Learning Techniques,” Springer Nature, Comput. Sci. 1345, p. 6, 2020,
https://doi.org/10.1007/s42979-020-00365-y |
| [9] | S. F. Waris and S. Koteeswaran, “Heart disease early prediction using a novel machine learning method called improved K-means neighbor classifier in python”, pp. 1–7, 2021,
https://doi.org/10.1016/j.matpr.2021.01.570 |
| [14] | Dibaba Adeba Debal, “Chronic Kidney Disease Prediction Using Machine Learning Techniques, Adama, Ethiopia,” 2021. |
| [3] | M. N. Uddin and R. K. Halder, “An ensemble method based multilayer dynamic system to predict cardiovascular disease using machine learning approach,” Informatics Med. Unlocked, vol. 24, p. 100584, 2021,
https://doi.org/10.1016/j.imu.2021.100584 |
[17, 21, 9, 14, 3]
and they were also better performed compared with other ML algorithms in predicting diseases.
KNN is very simple and easy to implement and it uses different neighbor distance criteria. KNN requires no training period and it doesn’t impact the accuracy. SVM is another ML classifier to develop the proposed HD prediction model. It could be classified as linear, non- linear, polynomial, radial basic function or sigmoid SVM and it uses a certain kinds of hyper plane or sets of hyper plane to classify linear and nonlinear datasets. SVM with a linear-kernel trick for classifying the dataset was done here. This study’s experimental set up also applies another ML model named as RF, which is a stable and achieves a higher accuracy. RF is also a very highly popular types of ML technique for classification of different tasks and allows an extra randomness by using several DT in parallel fitting technique called parallel ensemble technique. The other ML classifier and EL algorithm applied to develop HD prediction model was GB algorithm. GB is a types of EL technique which boosts or allows to convert weak classifiers in to strong ones. GB can also trains faster in a largest datasets and allows a predictors adding in to an ensemble and each of them corrects its predecessor predictor and it is proposed in this work to get the enhanced model. The last EL technique used to develop the proposed enhanced HD prediction model is VC. This classifier works by combining different classifiers for the same datasets by considering majority voting (MV). In MVC the base classifiers applied for model development are KNN, GB and RF. Finally, in order to get the most enhanced model for the detection of HD, ML algorithms i.e. RF, KNN, SVM, GB and VC (Ensemble of KNN, GB and RF) and models are evaluated through two different model evaluation techniques namely 10-F-CV and PS methods (data splitting in to 80% for training and 20% for testing) for the datasets.
3.1. Models Performance Evaluation Metrics
Classifiers can use different prediction performance measurement methods in model developing process, in order to evaluate different models performance. Some of the model performance evaluation metrics used are accuracy, precision, recall, F1-score, sensitivity, specificity and other fundamental confusion matrices terms of measurement such as True Positive TP, True Negative TN, False Positive FP and False Negative FN.
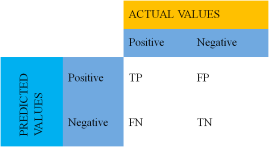
3.1.1. Confusion Matrices
Confusion matrices helps to find the correctness of the model predicted by considering TP, FP, TN and FN and helps us in measuring the values of accuracy, precision, recall, f1-score specificity and sensitivity. This study mainly considers binary class target values named as case or control considering CM shown in
Figure 3 below.
Figure 3. Confusion Matrices of Binary Class.
There are Four basic terms in Confusion Matrix:
TP: - The case of both Predicted value and Actual values being True.
TN: - The case of both Predicted values and Actual values being False.
FP: - The case of Predicted values being True & the Actual output values being False.
FN: - The case of predicted values being False while the Actual o/p values being True.
3.1.2. Accuracy
Accuracy defines the capability of a ML techniques to predict the given datasets target class depending on the datasets independent classes correctly. It implies how much the predicted value is close to the definite or the actual value. Classification accuracy can be computed using the equation (
2) below.
Accuracy=(2)
Accuracy calculating equation
Where, TN+TP= Number of correct prediction
TP+FP+TN+FN= the total number of predictions made
3.1.3. Precision
Precision is defines as the true or the positive samples correctly identified in the actual class
| [14] | Dibaba Adeba Debal, “Chronic Kidney Disease Prediction Using Machine Learning Techniques, Adama, Ethiopia,” 2021. |
[14]
of the prediction model. It is the ratio of TP values in the sample to the total positive samples predicted by the classifier. Precision can be calculated by equation (
3) below.
Precision calculating equation
3.1.4. Recall
Recall implies the TP values rates classified correctly
| [14] | Dibaba Adeba Debal, “Chronic Kidney Disease Prediction Using Machine Learning Techniques, Adama, Ethiopia,” 2021. |
[14]
. it is the ratio of the number of TP values in the sample to the summation of TP samples and FN samples in the predicted data. The recall can be calculated in equation (
4) below.
Precision calculating equation
3.1.5. F1-Score
F1-score or F-measure is the best measure for the test accuracy of the developed model. It is the harmonic mean of Recall and Precision. The higher the F1-score the better will be the performance of the developed model. The equation for F-measure shows in equation (
5) below.
F1score=2*(5)
F1-score calculating formula
3.1.6. Sensitivity
Sensitivity implies the TP rate and it is the ratio of the TP actual samples to the summation of TP and FN values in a given data
| [8] | C. B. C. Latha and S. C. Jeeva, “Improving the accuracy of prediction of heart disease risk based on ensemble classification techniques,” Informatics Med. Unlocked, vol. 16, no. July, p. 100203, 2019, https://doi.org/10.1016/j.imu.2019.100203 |
[8]
. It also implies the positive samples are identified as positive or correct with respect to all positive sample data’s given. Sensitivity can be calculated using the equation (
6) below:
Sensitivity score calculating equation
3.1.7. Specificity
Specificity implies the TN rate and it’s the ratio of the TN actual values or samples to the summation of the TN values and FP samples in a given data
| [8] | C. B. C. Latha and S. C. Jeeva, “Improving the accuracy of prediction of heart disease risk based on ensemble classification techniques,” Informatics Med. Unlocked, vol. 16, no. July, p. 100203, 2019, https://doi.org/10.1016/j.imu.2019.100203 |
[8]
. It can be the number of actual negative values or samples that are identified correctly with in the given data. Specificity can be calculated using the equation (
7) below:
Specificity calculating equation
3.2. Implementation Environment of the Prediction Model
Python programming language is used to develop the model. Python is a versatile or general purpose programming language that can be used to create a variety of ML and AI projects, including mobile and web applications. It helps to process ML images, texts and numbers using different formats through simple and easy ways. Anaconda navigator was used to install and launch different packages and libraries such as Jupiter note book, Sickie-learn, Pandas, Numpy, Matplotlib, Seaborrn and Flask server. The experimental work was deployed on personal laptop computer having a computer properties with processor of Intel (R) Core (TM) i5-7200U CPU @ 2.50GHz - 2.70 GHz, Installed RAM-4.00 GB (3.79 GB usable), 1000 GB HD storage and System type of Microsoft windows 10 prof with 64-bit operating system, x64-based processor.
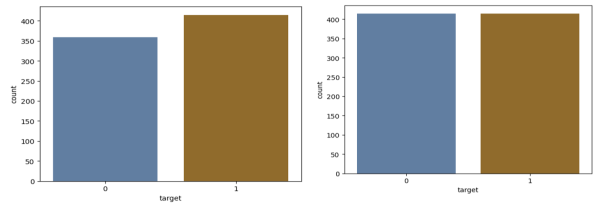
4. Results
After all the data preprocessing method was applied, unfortunately no data was dropped as no missing values or instances were exist. So after data preprocessing method the datasets was still the same to instances of 774 with instances 415 with HD and 359 instances of expected patients with no HD. The diagram below shows the binary class distribution of local WKUTRH HD datasets showing 53.6% (415 instances with HD) and 46.4% (359 instances with no HD). Since the datasets with a binary class distribution are not balanced, data resampling technique named as SMOTE (Synthetic Minority Oversampling) technique was applied. After applying SMOTE technique the class of the dataset have an equal instances of 415 diseased and 415 non-HD with a total balanced instances of 830.
Figure 4 below shows binary distribution of WKURTH HD datasets.
Figure 4. WKURTH HD datasets before and after balancing.
4.1. Model Building and Evaluation Results on the Original Datasets
After all the data preprocessing methods are done, 10-F-CV and PS technique with ML algorithms are applied for the datasets before and during FS methods. Models are evaluated through different model evaluation metrics for the balanced and non-balanced HD dataset. The next table shows the performance evaluation metrics results of each of these ML models for the original datasets during PS and 10-F-CV method. Such model performance evaluation matrices includes are Accuracy, Precision, Recall, F1-score, Sensitivity and Specificity and finally the results are shows in
Table 2 below:
Table 2. The PS and 10-F-CV evaluation results of the original HD datasets (balanced and non-balanced datasets).
HD Dataset | ML Model | Resampling | Splitting through | Performance Evaluation Metrics |
Accuracy | Precision | Recall | F1-score | Specificity | Sensitivity |
Local WKURTH HD Dataset | RF | Before | 80%/20% | 98.7 | 99.6 | 97.6 | 98.8 | 99.6 | 97.6 |
10-F-CV | 97.3 | 97.9 | 97.1 | 97.5 | 97.8 | 97.0 |
After | 80%/20% | 98.8 | 98.8 | 98.8 | 98.8 | 98.8 | 98.8 |
10-F-CV | 98.0 | 98.4 | 97.1 | 98.0 | 98.4 | 97.0 |
KNN | Before | 80%/20% | 97.4 | 98.8 | 96.4 | 97.6 | 98.6 | 96.4 |
10-F-CV | 94.7 | 96.9 | 93.2 | 95.0 | 95.6 | 93.1 |
After | 80%/20% | 98.8 | 99.7 | 97.6 | 98.8 | 99.6 | 97.6 |
10-F-CV | 94.8 | 98.2 | 91.3 | 94.5 | 97.6 | 91.3 |
SVM | Before | 80%/20% | 98.7 | 98.8 | 98.8 | 98.8 | 98.6 | 98.8 |
10-F-CV | 98.2 | 98.8 | 97.8 | 98.3 | 98.1 | 97.8 |
After | 80%/20% | 99.2 | 99.4 | 98.8 | 99.4 | 99.6 | 97.6 |
10-F-CV | 98.2 | 99.0 | 97.3 | 98.2 | 98.2 | 97.3 |
GB | Before | 80%/20% | 96.8 | 97.6 | 96.4 | 97.0 | 97.2 | 96.4 |
10-F-CV | 97.2 | 97.4 | 97.3 | 97.3 | 96.9 | 97.2 |
After | 80%/20% | 99.2 | 98.6 | 99.5 | 99.4 | 98.8 | 99.4 |
10-F-CV | 98.2 | 98.6 | 97.8 | 98.2 | 98.2 | 97.8 |
VC | Before | 80%/20% | 98.0 | 99.6 | 96.4 | 98.2 | 99.8 | 96.4 |
10-F-CV | 97.5 | 98.6 | 96.8 | 97.7 | 97.8 | 96.7 |
After | 80%/20% | 98.8 | 98.8 | 98.8 | 98.8 | 98.8 | 98.8 |
10-F-CV | 97.8 | 98.8 | 96.9 | 97.8 | 98.2 | 97.0 |
When we compare all algorithms before FS is applied, the highest and the better accuracy score of 99.2% was achieved in the second dataset using SVM and GB with PS. In addition to accuracy score other metrics was also evaluated such as precision, recall, f1-score, and specificity and sensitivity scores. So the better performance achiever models of SVM and GB has also achieved a good performance in others evaluation metrics. Thus, SVM achieved a Precision, Recall, F1-score, Sensitivity and Specificity score of 99.4%, 98.8%, 99.4%, 99.6% and 97.6% respectively. GB achieved a precision, recall, f1-score, sensitivity and specificity score of 98.6%, 99.5%, 99.4%, 98.8% and 99.4% respectively.
4.2. Results of Feature Selection Method
The FS process is applied using two FS methods, i.e. CFS and SFFS method. CFS can selects the most importance features among the given original features with the target variables, observed through the existence of relationship between them. In other hand, in the SFFS method every features of the datasets are computed sequentially with the proposed ML algorithm and performance is evaluated. The SFFS process was done on the HD dataset parallel with the proposed ML algorithms that are RF, SVM, KNN, GB and VC algorithms. In the
Table 3 below, we have summarized the selected features when we have applied FS techniques.
Table 3. The selected features for the datasets before and after resampling.
Datasets Used | Types of FS Used | ML Algorisms | Original Number of Features | Selected Number of Features Before Resampling | Selected Number of Features After Resampling |
(for PS method) | (for 10-F-CV splitting method) | (for PS method) | (for 10-F-CV splitting method) |
Local Heart Disease Datasets | CFS | RF | 14 | 12 | 12 | 12 | 12 |
KNN | 14 | 12 | 12 | 12 | 12 |
SVM | 14 | 12 | 12 | 12 | 12 |
GB | 14 | 12 | 12 | 12 | 12 |
VC | 14 | 12 | 12 | 12 | 12 |
SFFS | RF | 14 | 12 | 5 | 3 | 13 |
KNN | 14 | 5 | 5 | 5 | 5 |
SVM | 14 | 12 | 9 | 10 | 12 |
GB | 14 | 5 | 7 | 11 | 10 |
VC | 14 | 5 | 5 | 10 | 8 |
Model Results Evaluation for Individual HD Datasets during FS
In order to minimize the dataset features and to maximize better performance, applying FS method is optional. FS method is a good solution to reduce dimensionality of a datasets with unselecting non-relevant features by strengthening the performance of ML algorithms and maximizes the prediction performance of models by preventing over fitting problems. During SFFS and CFS method the models applied are also evaluated using PS and 10-F-CV method. here we have also applied and evaluated performance evaluation metric including accuracy, sensitivity, specificity, precision, recall and F1_score. All the results are putt in
Table 4 below:
Table 4. The PS and 10-F-CV evaluation results for the HD dataset After FS method (balanced and non-balanced datasets).
HD Dataset | FS Method Used | ML Model used | Resampling | Selected Feature | Splitting through | Performance Evaluation Metrics |
Accuracy | Precision | Recall | F1-score | Specificity | Sensitivity |
Local Hospital HD Dataset | CFS Method | RF | Before | 12 | 80/20% | 98.1 | 98.8 | 97.6 | 98.2 | 98.6 | 97.6 |
10-F-CV | 97.2 | 98.1 | 96.6 | 97.3 | 98.0 | 96.5 |
After | 80/20% | 99.4 | 98.8 | 99.5 | 99.4 | 98.9 | 99.5 |
10-F-CV | 97.8 | 98.6 | 97.1 | 98.0 | 98.4 | 97.0 |
KNN | Before | 12 | 80/20% | 96.8 | 97.6 | 96.4 | 97.0 | 97.2 | 96.4 |
10-F-CV | 95.3 | 97.6 | 93.7 | 95.5 | 97.4 | 93.6 |
After | 80/20% | 94.6 | 96.1 | 92.4 | 94.2 | 96.6 | 92.4 |
10-F-CV | 95.7 | 98.0 | 93.2 | 95.5 | 97.8 | 93.1 |
SVM | Before | 12 | 80/20% | 98.1 | 97.6 | 98.8 | 98.2 | 97.2 | 98.8 |
10-F-CV | 98.2 | 98.8 | 97.8 | 98.3 | 98.2 | 97.8 |
After | 80/20% | 97.6 | 95.2 | 98.5 | 97.5 | 96.6 | 92.4 |
10-F-CV | 98.3 | 98.8 | 97.8 | 98.3 | 97.8 | 97.8 |
GB | Before | 12 | 80/20% | 97.4 | 97.6 | 97.6 | 97.6 | 97.2 | 97.6 |
10-F-CV | 97.3 | 97.4 | 97.6 | 97.5 | 96.9 | 97.5 |
After | 80/20% | 98.2 | 96.3 | 98.8 | 98.1 | 96.6 | 98.8 |
10-F-CV | 98.0 | 98.3 | 97.6 | 98.0 | 98.0 | 97.5 |
VC | Before | 12 | 80/20% | 98.7 | 99.6 | 97.6 | 98.8 | 99.6 | 97.6 |
10-F-CV | 97.4 | 98.6 | 96.6 | 97.6 | 98.4 | 96.6 |
After | 80/20% | 99.4 | 98.8 | 99.6 | 99.4 | 98.9 | 99.6 |
10-F-CV | 97.7 | 98.6 | 96.9 | 97.7 | 97.8 | 97.0 |
SFFS Method | RF | Before | 3 | 80/20% | 99.5 | 99.5 | 99.5 | 98.8 | 99.4 | 99.5 |
5 | 10-F-CV | 98.5 | 98.2 | 98.5 | 98.6 | 98.3 | 98.5 |
After | 12 | 80/20% | 99.3 | 99.4 | 99.3 | 99.2 | 99.3 | 99.2 |
13 | 10-F-CV | 99.0 | 99.1 | 98.8 | 98.9 | 98.9 | 98.8 |
KNN | Before | 5 | 80/20% | 98.2 | 98.2 | 98.2 | 98.3 | 98.2 | 98.2 |
5 | 10-F-CV | 98.2 | 98.2 | 98.2 | 98.3 | 98.4 | 98.2 |
After | 5 | 80/20% | 98.0 | 98.3 | 98.5 | 98.0 | 98.2 | 98.4 |
5 | 10-F-CV | 98.1 | 98.5 | 98.5 | 98.0 | 98.0 | 98.4 |
SVM | Before | 12 | 80/20% | 98.1 | 99.4 | 97.3 | 98.2 | 99.0 | 97.2 |
9 | 10-F-CV | 97.4 | 97.6 | 94.0 | 97.1 | 97.6 | 94.1 |
After | 10 | 80/20% | 98.2 | 99.0 | 97.9 | 98.2 | 98.8 | 98.0 |
12 | 10-F-CV | 97.7 | 98.2 | 97.3 | 97.7 | 97.8 | 97.2 |
GB | Before | 7 | 80/20% | 99.5 | 99.5 | 99.5 | 99.5 | 99.6 | 99.4 |
5 | 10-F-CV | 98.5 | 98.5 | 98.2 | 98.6 | 98.8 | 98.0 |
After | 11 | 80/20% | 99.3 | 99.3 | 99.3 | 99.4 | 99.4 | 99.3 |
10 | 10-F-CV | 98.6 | 98.2 | 98.8 | 98.6 | 98.2 | 98.9 |
VC | Before | 5 | 80/20% | 99.5 | 99.5 | 99.3 | 99.6 | 99.6 | 99.3 |
5 | 10-F-CV | 98.5 | 98.5 | 98.2 | 98.6 | 98.4 | 98.1 |
After | 10 | 80/20% | 99.3 | 99.3 | 99.1 | 99.2 | 99.1 | 99.0 |
8 | 10-F-CV | 99.0 | 98.5 | 98.8 | 99.1 | 98.6 | 98.8 |
During these two FS process time, for this local HD dataset before resampling technique was applied, SFFS with RF (selecting 3 features), SFFS with GB (selecting 7 features) and SFFS with VC (selecting 5 features) all achieved an accuracy scores of 99.5% and 98.5% using PS and 10-F-CV method respectively. However, after applying resampling technique, different performance results are registered, i.e. both CFS with RF (selecting 12 features) and CFS with VC (selecting 12 features) using PS method achieved a better accuracy scores of 99.4% and CFS with SVM (selecting 12 features) achieved a good accuracy scores of 98.3% using 10-F-CV method. In other hand SFFS with RF (selecting 12 features), SFFS with GB (selecting 11 features) and SFFS with VC (selecting 10 features) all achieving a respective and a good scores of 99.3% using PS technique, while SFFS with RF (selecting 13 features) and SFFS with VC (selecting 8 features) both achieving a good scores of 99.0% using 10-F-CV. In addition to accuracy score evaluation, other performance evaluators such as Precision, Recall, F1-score, Sensitivity and Specificity are also evaluated and better results are achieved i.e. CFS with RF achieved respective scores of 98.8%, 99.5%, 99.4%, 99.5% and 98.9%. While for CFS with VC achieved scores of 98.8%, 99.6%, 99.4%, 99.6% and 98.9%.
Finally 12 relevant features was selected using CFS Method for this local datasets and similarly using SFFS method and PS technique RF selects 12, KNN selects 5, SVM selects 10, GB selects 11, and VC selects 10 features. While using 10-F-CV technique RF selects 13, KNN selects 5, SVM selects 12, GB selects 10, and VC selects 8 features in respective way.
5. Discussion
Although several studies are done related with ML technique and disease prediction, most of these works related with HD detection and prediction are done outside the country, Ethiopia. This shows almost there is a little studies are conducted in Ethiopia related with ML techniques with FS and HD. However, related works are done in the prediction of other diseases such as CKD
| [16] | I. D. Mienye, Y. Sun, and Z. Wang, “An improved ensemble learning approach for the prediction of heart disease risk,” Informatics Med. Unlocked, vol. 20, p. 100402, 2020,
https://doi.org/10.1016/j.imu.2020.100402 |
[16]
and heart related cases such as a literature in
| [8] | C. B. C. Latha and S. C. Jeeva, “Improving the accuracy of prediction of heart disease risk based on ensemble classification techniques,” Informatics Med. Unlocked, vol. 16, no. July, p. 100203, 2019, https://doi.org/10.1016/j.imu.2019.100203 |
[8]
proposed an ensemble classification method for prediction of HD risk and MV achieving an accuracy of 85.48% was the highest of all the applied classifiers and the researcher proposed MV technique for the prediction of HD risk. The proposed work in
| [16] | I. D. Mienye, Y. Sun, and Z. Wang, “An improved ensemble learning approach for the prediction of heart disease risk,” Informatics Med. Unlocked, vol. 20, p. 100402, 2020,
https://doi.org/10.1016/j.imu.2020.100402 |
[16]
, proposed an EML method to improve ensemble technique for the prediction of HD risk and AB-WAE was achieved a better accuracy of 93% and 91% with in two different public datasets. A paper in
| [9] | S. F. Waris and S. Koteeswaran, “Heart disease early prediction using a novel machine learning method called improved K-means neighbor classifier in python”, pp. 1–7, 2021,
https://doi.org/10.1016/j.matpr.2021.01.570 |
[9]
also proposed a study to save life of HD patient by predicting HD over a few significant parameters of the heart and KNN and Novel-KNN methods achieved a respective accuracy of 88% and 93%
also proposed HRFLM method aims in finding significant features or attributes and resulting in improving the accuracy of prediction for CVD specially HD and achieved a better accuracy of 88.7% using HRFLM method. The other paper referred in
| [18] | G. Ramesh, K. Madhavi, P. D. Kumar, J. Somasekar, and J. Tan, “Improving the accuracy of heart attack risk prediction based on information gain feature selection technique,”, 2020,
https://doi.org/10.1016/j.matpr.2020.12.079 |
[18]
proposed an improved accuracy of heart attack risk prediction based on IGFS method assuming to boost a ML classifier performance and a better accuracy using SVM with FS achieved an accuracy of 88.9812% and RF with FS achieved an accuracy of 88.9812%. Similarly a paper in
| [19] | M. S. Amin, Y. K. Chiam, and K. D. Varathan, “Identification of significant features and data mining techniques in predicting heart disease,” Telemat. Informatics, 2018,
https://doi.org/10.1016/j.tele.2018.11.007 |
[19]
proposed an identification of significant features and data mining methods in prediction of HD and finally a higher performing data mining algorithm having an accuracy of 87.4% was achieved by VC (ensemble of NB and LR) in predicting Cleveland HD datasets used after FS was applied. In the same way a paper work in
| [20] | H. Takci, “Improvement of heart attack prediction by the feature selection methods,” Turkish J. Electr. Eng. Comput. Sci. · January 2018, no. January 2018, 2020,
https://doi.org/10.3906/elk-1611-235 |
[20]
proposed an improved heart attack prediction by using ML techniques combined with FS method aiming in identifying the best model and best FS method, the experiment of this work shows that SVM (linear-kernel) achieves a better result in combination with relief-F FS method with accuracy scores of 84.81% to predict heart attack applied on Statlog HD dataset. It was also a paper referred in
, proposed HD prediction method using ML, aiming in envision of the probability in developing HD in a specified patient through computerized predicting technique, finally the highest performance was achieved by using KNN, achieving an accuracy of 90.789% to predict the Cleveland HD datasets. The last paper summarized here is
, which proposed a HD prediction methodology using ML, two separated datasets such as Cleveland HD datasets having 303 instances and CLbSHS having 1190 instances with were used and different results achieved, however after combining these two datasets a better accuracy score of 93.31% was achieved using RF. Most of the above HD related literatures are done outside the country Ethiopia. In most of the works related with HD prediction outside Ethiopia, local datasets are not included and the FS they applied is not clearly identified and etc.
The proposed study here, which introduces a detection of HD enhancing prediction performance through ML algorithms such as RF, KNN, SVM, GB and VC with two FS methods namely CFS and SFFS. To do the experiment local HD datasets are employed. First, the experiment was done on the original and imbalanced datasets and then after done on the balanced datasets.
To validate the different model performance metric, two validation and splitting techniques such as PS and 10-F-CV techniques was applied on the dataset. Finally after balancing the dataset, the two FS methods are applied and a better performing algorisms are registered. As balanced dataset can have a better effects in ML model, in case of reducing over fitting and biases, we have used balanced HD datasets before and after FS methods are applied and performance Evaluation metrics such as Accuracy, Precision, Recall, F1-score, Sensitivity and Specificity are also evaluated and different results are registered. Comparison between the proposed HD detection and prediction model and other previously related literatures on the prediction of HD are shown in the
Table 5 below.
Table 5. Comparison between the proposed models with the previous works.
ML Models Applied on the previous works | Feature Selection method Used | The Model achieving the best accuracy score |
BN, NB, RF, C45, PART, MLP, MVC, Bagging and Boosting | [8] | C. B. C. Latha and S. C. Jeeva, “Improving the accuracy of prediction of heart disease risk based on ensemble classification techniques,” Informatics Med. Unlocked, vol. 16, no. July, p. 100203, 2019, https://doi.org/10.1016/j.imu.2019.100203 |
[8] | BFFS method | 85.48% by MVC |
CART, Ensemble of AB-WAE | [16] | I. D. Mienye, Y. Sun, and Z. Wang, “An improved ensemble learning approach for the prediction of heart disease risk,” Informatics Med. Unlocked, vol. 20, p. 100402, 2020,
https://doi.org/10.1016/j.imu.2020.100402 |
[16] | No FS method | 91% for Framingham and 93% for Cleveland |
KNN and Improved KNN=K+PN | [9] | S. F. Waris and S. Koteeswaran, “Heart disease early prediction using a novel machine learning method called improved K-means neighbor classifier in python”, pp. 1–7, 2021,
https://doi.org/10.1016/j.matpr.2021.01.570 |
[9] | No FS method | 88% by KNN and 93% by improved KNN |
RF and LM separately, HRFLM | DT entropy based FS | 88.7% by HRFLM |
RF, KNN, NB, DT, LM, SVM | [18] | G. Ramesh, K. Madhavi, P. D. Kumar, J. Somasekar, and J. Tan, “Improving the accuracy of heart attack risk prediction based on information gain feature selection technique,”, 2020,
https://doi.org/10.1016/j.matpr.2020.12.079 |
[18] | IGFS method | 88.982% by RF-IGFS and 88.981% by SVM-IGFS. |
DT, NB, NN, KNN, SVM, LM and VC (NB and LM) | [19] | M. S. Amin, Y. K. Chiam, and K. D. Varathan, “Identification of significant features and data mining techniques in predicting heart disease,” Telemat. Informatics, 2018,
https://doi.org/10.1016/j.tele.2018.11.007 |
[19] | BFFS method | 87.4% by VC |
C45. Binary LR, SVM (Sigmoid, Linear, RBF, polynomial), CRT, KNN, ID3, NB, Multinomial LR and MLP | [20] | H. Takci, “Improvement of heart attack prediction by the feature selection methods,” Turkish J. Electr. Eng. Comput. Sci. · January 2018, no. January 2018, 2020,
https://doi.org/10.3906/elk-1611-235 |
[20] | SBFS and SFFS, Filtering and Relief-F from FFS method | 84.81% by Linear-SVM with Relief-F FS method. |
DT, NB, KNN and RF | No FS method | 90.789% by KNN |
LM, NB, SVM, KNN and Ensemble of XGB | No FS method | 93.3% by RF for combined dataset. |
The Proposed Work | RF, KNN, SVM, GB and VC | SFFS and CFS | Before FS, SVM and GB achieved accuracy of 99.2% & After FS, RF with CFS and VC with CFS achieved 99.4%, using PS method. |
Before applying FS method, SVM and GB achieved a good scores of 99.2% and finally the model which we recommended for the final model development holds 12 features of independent variables with 1 target values, using RF with CFS and VC with CFS method for balanced datasets using PS method.
6. Conclusion
In this study, detection of HD enhancing prediction through ML technique is proposed in order to predict the disease early and prevent further distribution of the disease in the expected patient and helps health care experts or professionals to make early decision making. To choose the most pertinent features for the HD prediction, two distinct FS methods were used. In this case, Before FS methods are applied for the local balanced HD datasets, SVC and GB achieved an accuracy scores of 99.2% each using PS. While both RF with CFS and VC with CFS for balanced datasets using PS method a better accuracy score results of 99.4% was achieved and those models are recommended for the prediction of heart disease. As a result both RF with and VC with CFS could help users or experts to predict HD in expected patient record.
Abbreviations
10-F-CV | 10-Fold-Cross Validation |
AB-WAE | Accuracy Based Weight Adge Ensemble |
AI | Artificial Intelligence |
BFFS | Backward Feature Selection Method |
CART | Classification and Regression Tree |
CFS | Chi-Square |
CHD | Coronary Heart Disease |
CKD | Chronic Kidney Disease |
CLbSHS | Cleveland Long Beach Switzerland and Hungarian |
CSV | Comma Separated Values |
CVD | Cardiovascular Disease |
DT | Decision Tree |
EL | Ensemble Learning |
FN | False Negative |
FP | False Positive |
FS | Feature Selection Method |
GB | Gradient Boosting |
HD | Heart Disease |
HRFLM | Hybridized Random Forest and Linear Modeling |
IGFS | Information Gain Feature Selection Method |
IHD | Ischemic Heart Disease |
KNN | K Nearest Neighbor |
LR | Logistic Regression |
ML | Machine Learning |
MVC | Majority of Voting Classifier |
NB | Naive Bayes |
NCD | Non-Communicable Diseases |
NN | Neural Network |
PN | Prime Number |
PS | Percentage Splitting |
RF | Random Forest |
SFFS | Sequential Forward Feature Selection |
SMOTE | Synthetic Minority Oversampling Technique |
SVM | Support Vector Machine |
TN | True Negative |
TP | True Positive |
USML | Un Supervised Machine Learning |
VC | Voting Classifier |
WHO | World Health Organization |
WKUTRH | Wolkite University Teaching and Referral Hospital |
XGB | Extra Gradient Boosting |
Acknowledgments
First I would like to thanks my advisor Dr. Mesfin Abebe and some of my previous staff in Wolkite University especially, Mr. Mitiku mammo and WKURTH staffs, coordinator of outpatient ward, especially Dr. Mustejab, for his special commitment in supporting to get the real and detail information in the time of collecting datasets.
Conflicts of Interest
The authors declare no conflicts of interest.
References
| [1] |
Yash Jayesh Chauhan, “Cardiovascular Disease Prediction using Classification Algorithms of Machine Learning,” Int. J. Sci. Res., vol. Volume 9, no. Isuue 5 May, pp. 194–200, 2020,
https://doi.org/10.21275/SR20501193934
|
| [2] |
K. Vembandasamy, R. Sasipriya, and E. Deepa, “Heart Diseases Detection Using Naive Bayes Algorithm,” Int. J. Innov. Sci. Eng. Technol., vol. 2, no. 9, pp. 441–444, 2015.
|
| [3] |
M. N. Uddin and R. K. Halder, “An ensemble method based multilayer dynamic system to predict cardiovascular disease using machine learning approach,” Informatics Med. Unlocked, vol. 24, p. 100584, 2021,
https://doi.org/10.1016/j.imu.2021.100584
|
| [4] |
S. Bashir, U. Qamar, and M. Y. Javed, “An Ensemble based Decision Support Framework for Intelligent Heart Disease Diagnosis,” 2014,
https://doi.org/10.1109/i-Society.2014.7009056
|
| [5] |
D. A. Angaw, R. Ali, A. Tadele, and S. Shumet, “The prevalence of cardiovascular disease in Ethiopia : a systematic review and meta - analysis of institutional and community - based studies,” pp. 1–9, 2021,
https://doi.org/10.1186/s12872-020-01828-z
|
| [6] |
D. Yadeta, W. Walelgne, J. M. Fourie, W. Scholtz, O. Scarlatescu, and G. Nel, “Cardiovascular Topics Ethiopia Country Report PASCAR and WHF Cardiovascular Diseases Scorecard project,” vol. 32, no. 1, pp. 37–46, 2021,
https://doi.org/10.5830/CVJA-2021-001
|
| [7] |
D. Zhang et al., “Heart Disease Prediction Based on the Embedded Feature Selection Method and Deep Neural Network,” vol. 2021, no. Ml, 2021,
https://doi.org/10.1155/2021/6260022
Research.
|
| [8] |
C. B. C. Latha and S. C. Jeeva, “Improving the accuracy of prediction of heart disease risk based on ensemble classification techniques,” Informatics Med. Unlocked, vol. 16, no. July, p. 100203, 2019,
https://doi.org/10.1016/j.imu.2019.100203
|
| [9] |
S. F. Waris and S. Koteeswaran, “Heart disease early prediction using a novel machine learning method called improved K-means neighbor classifier in python”, pp. 1–7, 2021,
https://doi.org/10.1016/j.matpr.2021.01.570
|
| [10] |
S. and A. C. M. Guido, Introduction to Machine Learning with Python, ISBN- 9352134575, 9789352134571, O'Reilly Media, Incorporated, 2018, 2016.
|
| [11] |
W. Richert and L. P. Coelho, Building Machine Learning Systems with Python, 271 pages, 2013.
|
| [12] |
H. E. Taye and A. Science, “MACHINE LEARNING BASED CHRONIC KIDNEY DISEASE PREDICTION MODEL Adama, Ethiopia,” 2021.
|
| [13] |
S. D. D. Kriti Gandhi, Mansi Mittal, Neha Gupta, “Disease Prediction using Machine Learning,” Int. J. Res. Appl. Sci. Eng. Technol. ijraset Cite, vol. 8, no. June 2020, VI, pp. 1–12, 2022,
https://doi.org/10.22214/ijraset.2020.6077
|
| [14] |
Dibaba Adeba Debal, “Chronic Kidney Disease Prediction Using Machine Learning Techniques, Adama, Ethiopia,” 2021.
|
| [15] |
S. N. Kassaye, K. Kakeba, B. G. Ieee-member, and A. Dessie, “Rheumatic Heart Disease Detection Using Machine Learning Techniques,” 2021, pp. 1–20.
|
| [16] |
I. D. Mienye, Y. Sun, and Z. Wang, “An improved ensemble learning approach for the prediction of heart disease risk,” Informatics Med. Unlocked, vol. 20, p. 100402, 2020,
https://doi.org/10.1016/j.imu.2020.100402
|
| [17] |
S. Mohan, C. Thirumalai, and G. Srivastava, “Effective Heart Disease Prediction using Hybrid Machine Learning Techniques,” IEEE Access, vol. PP, p. 1, 2019,
https://doi.org/10.1109/ACCESS.2019.2923707
|
| [18] |
G. Ramesh, K. Madhavi, P. D. Kumar, J. Somasekar, and J. Tan, “Improving the accuracy of heart attack risk prediction based on information gain feature selection technique,”, 2020,
https://doi.org/10.1016/j.matpr.2020.12.079
|
| [19] |
M. S. Amin, Y. K. Chiam, and K. D. Varathan, “Identification of significant features and data mining techniques in predicting heart disease,” Telemat. Informatics, 2018,
https://doi.org/10.1016/j.tele.2018.11.007
|
| [20] |
H. Takci, “Improvement of heart attack prediction by the feature selection methods,” Turkish J. Electr. Eng. Comput. Sci. · January 2018, no. January 2018, 2020,
https://doi.org/10.3906/elk-1611-235
|
| [21] |
D. Shah, S. Patel, and S. Kumar, “Heart Disease Prediction using Machine Learning Techniques,” Springer Nature, Comput. Sci. 1345, p. 6, 2020,
https://doi.org/10.1007/s42979-020-00365-y
|
| [22] |
N. Bora, “Using Machine Learning to Predict Heart Disease,” Calif. STATE Univ. SAN MARCOS Proj.
https://doi.org/10.37394/23208.2022.19.1
2021.
|
| [23] |
U. F. Njoku and A. Abelló, “Impact of filter feature selection on classification : an empirical study,” vol. 3130, 2022.
|
| [24] |
Y. B. Wah, Ibrahim, Nurain, and H. A. Hamid, “Feature selection methods : Case of filter and wrapper approaches for maximising classification accuracy, SCIENCE & TECHNOLOGY, ISSN 0128-7680 e-ISSN 2231-8526, January, 2018.
|
| [25] |
V. Verma, “A comprehensive guide to Feature Selection using Wrapper methods in Python,” 2020.
|
| [26] |
A. Garg, B. Sharma, and R. Khan, “Heart disease prediction using machine learning techniques,” IOP Conf. Ser. Mater. Sci. Eng., vol. 1022, no. 1, 2021,
https://doi.org/10.1088/1757-899X/1022/1/012046
|
Cite This Article
-
APA Style
Areb, S. T., Abebe, M. (2026). Early Detection of Heart Disease: Enhancing Prediction Through Machine Learning Techniques. Science Research, 14(2), 28-41. https://doi.org/10.11648/j.sr.20261402.12
 Copy
|
Copy
|
 Download
ACS Style
Areb, S. T.; Abebe, M. Early Detection of Heart Disease: Enhancing Prediction Through Machine Learning Techniques. Sci. Res. 2026, 14(2), 28-41. doi: 10.11648/j.sr.20261402.12
Copy
|
Download
AMA Style
Areb ST, Abebe M. Early Detection of Heart Disease: Enhancing Prediction Through Machine Learning Techniques. Sci Res. 2026;14(2):28-41. doi: 10.11648/j.sr.20261402.12
Copy
|
Download
-
@article{10.11648/j.sr.20261402.12,
  author = {Sirage Temame Areb and Mesifin Abebe},
  title = {Early Detection of Heart Disease: Enhancing Prediction Through Machine Learning Techniques},
  journal = {Science Research},
  volume = {14},
  number = {2},
  pages = {28-41},
  doi = {10.11648/j.sr.20261402.12},
  url = {https://doi.org/10.11648/j.sr.20261402.12},
  eprint = {https://article.sciencepublishinggroup.com/pdf/10.11648.j.sr.20261402.12},
  abstract = {Heart disease is the abnormal health condition that influences parts of the heart and all its parts. World Health Organization (WHO) is assured that the disease is one of the leading killer disease of the worldwide population. The prevalence of the disease is also increasing through developing countries like Ethiopia. Machine Learning (ML) is one of the key technique in the management and processing of a huge number of health data’s and it supports in diagnosis and prediction of disease at early stages. The main objective of this study is developing an early detection of Heart Disease (HD) enhancing prediction through ML technique; such as Random forest (RF), K Nearest Neighbor (KNN), Support vector Machine (SVM), Gradient Boosting (GB) and Voting Classifier with two Feature Selection (FS) methods, of Chi-Square (CFS) and Sequential Forward Feature Selection (SFFS) methods. The data used for the experimentation purpose was collected from Local Hospitals. Before FS methods are performed, all the ML algorithms are applied for the imbalanced and balanced HD dataset. Then after, the two FS methods are applied with ML techniques on these imbalanced and balanced datasets. Models are evaluated through different model evaluation metrics with two data splitting technique namely Percentage Splitting (PS) and 10-Fold-Cross Validation (10-F-CV) techniques and finally different results are registered. Thus, before FS methods are applied on the full balanced datasets, SVM and GB achieved a good accuracy score of 99.2% using PS and similarly after FS technique is applied, Both RF with CFS and VC with CFS achieved a better accuracy score of 99.4% using PS for the combined dataset, so this will helps users and experts to detect and appropriate prevention of the disease at an early stage.},
 year = {2026}
}
Copy
|
Download
-
TY  - JOUR
T1  - Early Detection of Heart Disease: Enhancing Prediction Through Machine Learning Techniques
AU  - Sirage Temame Areb
AU  - Mesifin Abebe
Y1  - 2026/03/19
PY  - 2026
N1  - https://doi.org/10.11648/j.sr.20261402.12
DO  - 10.11648/j.sr.20261402.12
T2  - Science Research
JF  - Science Research
JO  - Science Research
SP  - 28
EP  - 41
PB  - Science Publishing Group
SN  - 2329-0927
UR  - https://doi.org/10.11648/j.sr.20261402.12
AB  - Heart disease is the abnormal health condition that influences parts of the heart and all its parts. World Health Organization (WHO) is assured that the disease is one of the leading killer disease of the worldwide population. The prevalence of the disease is also increasing through developing countries like Ethiopia. Machine Learning (ML) is one of the key technique in the management and processing of a huge number of health data’s and it supports in diagnosis and prediction of disease at early stages. The main objective of this study is developing an early detection of Heart Disease (HD) enhancing prediction through ML technique; such as Random forest (RF), K Nearest Neighbor (KNN), Support vector Machine (SVM), Gradient Boosting (GB) and Voting Classifier with two Feature Selection (FS) methods, of Chi-Square (CFS) and Sequential Forward Feature Selection (SFFS) methods. The data used for the experimentation purpose was collected from Local Hospitals. Before FS methods are performed, all the ML algorithms are applied for the imbalanced and balanced HD dataset. Then after, the two FS methods are applied with ML techniques on these imbalanced and balanced datasets. Models are evaluated through different model evaluation metrics with two data splitting technique namely Percentage Splitting (PS) and 10-Fold-Cross Validation (10-F-CV) techniques and finally different results are registered. Thus, before FS methods are applied on the full balanced datasets, SVM and GB achieved a good accuracy score of 99.2% using PS and similarly after FS technique is applied, Both RF with CFS and VC with CFS achieved a better accuracy score of 99.4% using PS for the combined dataset, so this will helps users and experts to detect and appropriate prevention of the disease at an early stage.
VL  - 14
IS  - 2
ER  -
Copy
|
Download