Research Article | | Peer-Reviewed

Analyzing Sunflower Trait Patterns Using MANOVA, PCA, and Correlation Across Seasons and Locations

Received: 30 August 2024     Accepted: 18 September 2024     Published: 29 September 2024
Views:       Downloads:
Abstract

Sunflower is an important agricultural crop valued for its high oil yield, versatility in culinary and industrial applications and adaptability to diverse environments. Eight advanced sunflower genotypes were tested in a randomized complete block design (RCBD) with three replications at six locations over the 2018 and 2019 seasons. The study aimed to evaluate the effects of environmental and genotypic variations using MANOVA, PCA, and correlation analysis to discover trait patterns and relationships. The MANOVA results revealed highly significant effects of genotype, environment, and their interaction on the 11 dependent variables (p < 0.001). The four principal components account for 74.23% of the total variation, with key traits such as seed yield per hectare, oil yield per hectare, days to maturity, plant height, and grain filling period significantly contributing to the overall variability. Oil yield per hectare and seed yield per hectare exhibited a very strong association (0.974). Days to maturity (DM) and grain filling period (GFP) showed a strong correlation (0.666), suggesting that longer grain filling periods may enhance both maturity and yield. Additionally, plant height (PH) and seed yield per hectare (YELDK) had a moderate correlation (0.491). Breeding programs should target traits with strong correlations to boost sunflower productivity and adaptability. Future research should prioritize selecting genotypes that perform well across diverse environments, focusing on seed yield, oil yield, and traits such as maturity and grain filling period. Additionally, breeding should incorporate disease resistance and optimize days to flowering to develop more robust and productive sunflower varieties.

Published in American Journal of Biological and Environmental Statistics (Volume 10, Issue 3)
DOI 10.11648/j.ajbes.20241003.16
Page(s) 87-95
Creative Commons

This is an Open Access article, distributed under the terms of the Creative Commons Attribution 4.0 International License (http://creativecommons.org/licenses/by/4.0/), which permits unrestricted use, distribution and reproduction in any medium or format, provided the original work is properly cited.

Copyright

Copyright © The Author(s), 2024. Published by Science Publishing Group

Keywords

Multivariate Analysis, Oil Yield, Phenotypic Variation, Seed Yield and Trait Associations

1. Introduction
Sunflower breeding is of paramount importance due to the crop's role as a significant oilseed with diverse applications ranging from oil production to confectionery uses. This crop holds substantial value in both food security and renewable energy sectors, providing resources for culinary oil and biofuels . The ultimate goal of sunflower breeding is to improve traits like oil content, disease resistance, yield, and drought tolerance . The study of these parameters is critical for enhancing the productivity and adaptability of sunflower to flourish in diverse and changing environments. Examining these factors is a vital step in maximizing crop resilience and performance, which will ultimately address the growing demand of global markets and support agricultural sustainability .
Genotypic variation and seasonal factors significantly impact sunflower performance. Multivariate Analysis of Variance (MANOVA) is well-suited for evaluating these effects on multiple traits simultaneously . By analyzing several traits at once, MANOVA provides a comprehensive view of trait interactions, helping breeders identify correlations and make informed selections. This approach accelerates breeding programs by enabling the concurrent selection of multiple traits, improving efficiency, and developing robust crop varieties. Unlike univariate analyses, MANOVA reveals complex relationships between traits, enhancing the accuracy and effectiveness of breeding efforts. It extends traditional Analysis of Variance (ANOVA) to multiple dependent variables, offering a more accurate and streamlined analysis . Principal component Analysis (PCA) and correlation analysis are essential tools in crop breeding, offering deep insights into trait interactions and genetic diversity. crop performance and genotype selection. By considering relationships between multiple traits, these methods address the limitations of univariate analyses able to understand crop performance and facilitate genotype selection. They enhance understanding of trait relationships and genetic diversity, helping breeders identify key traits, understand crop architecture, and develop more efficient breeding strategies . PCA effectively utilized in different crops based on morpho-physiological and yield traits . Correlation analysis complements PCA by quantifying the strength and direction of relationships between traits. This analysis identifies how traits are associated with one another, helping breeders understand which traits can be improved simultaneously. Together, PCA and correlation analysis provide a comprehensive approach to trait evaluation, enhancing decision-making and accelerating the development of high-performing crop varieties . PCA and correlation analysis were previously reported by different authors in sunflower and other crops based on morpho-physiological and yield traits .
Plant breeding programs aim to improve one or more traits at the same time, with yield increase being the most important objective. Hence, direct selection for yield is less efficient in improving sunflower productivity. Efficiency in yield improvement can be enhanced by exploiting the relationship between yield and its associated traits. it would be possible to elucidate the most important traits that would help in achieving progress. principal component analysis also helps in determination of genetic relationship among characters in crop improvement . Understanding the relationship between seed yield and other related traits, and deciphering these variations through simultaneous character improvement is vital for fruitful sunflower breeding programs . This study aims to evaluate sunflower traits across six environments over two seasons using MANOVA to assess the impact of environmental and genotypic variations, PCA to identify key patterns and sources of trait variation, and correlation analysis to explore relationships between traits for informed breeding decisions.
2. Materials and Methods
2.1. Plant Materials and Experimental Layout
Eight advanced sunflower genotypes were grown in randomized complete block design (RCBD) with three replications at six locations during 2018 and 2019 main cropping season (Table 1). Each plot consists of five rows of 3 m length and 75 cm apart. Data such as powdery mildew (PM), blight (Bli), 50% days to flowering (FD), 50% days to maturity (MD) and grain filling period (GFP) were recorded from whole plot based. Whereas, plant height (PH) and head diameter (HD) data were recorded from five randomly selected plants from three central rows of each plot. The central three rows were harvested during maturity and data such as seed yield per hectare (YELDK), thousand seed weight (TSW), oil content (OC) and oil yield per hectare (OYLD) were collected from the harvested rows. The harvested plot yield were adjusted to 7% moisture content and converted to yield per hectare.
2.2. Data Analysis
2.2.1. Multivariate Analysis of Variance (MANOVA)
To evaluate the effects of Genotype and Environment on multiple dependent traits MANOVA was conducted. This model examines how genotype (Factor 1) and environment (Factor 2), as well as their interaction, influence the set of dependent traits. The manova function in R software was employed to evaluate the hypothesis and ascertain whether there are significant differences in the mean vectors of the dependent variables at different levels of the factors and their interactions. The MANOVA model used to conduct the analysis was specified as described by Tabachnick and Fidell .
Y=Xβ+E
Where:
Y = represents the matrix of dependent variables. These variables are measured simultaneously and include outcomes.
X = represents the design matrix of independent variables, which includes: Factor1 (genotype) a categorical variable representing different genetic variations or treatments; Factor2: Another categorical variable representing different environmental conditions or treatments/factors and an interaction term that captures the combined effect of Factor1 and Factor2 on the dependent variables (assesses whether the effect of Genotype on the dependent traits varies depending on the levels of Environment).
β = represents the vector of coefficients for the independent variables and their interactions.
E = represents the matrix of residuals or errors.
Table 1. Description of Experimental Materials and Test Locations for Evaluating Sunflower Genotypes (2018-2019) Using MANOVA, PCA, and Correlation Analysis.

Sr. No.

Genotypes

Genotype code

Environment

Season name

Code

Season name

Code

1

Adadi -2-013-6/7/1/2/5

G1

Holetta 2018

E1

Maki 2019

E9

2

Brazil short seed

G2

Adadi 2018

E2

Ambo 2019

E10

3

NK-Kondi-013-15/5/4

G3

Maki 2018

E3

Ghinchi 2019

E11

4

Adadi-1-014-21/4/3

G4

Ambo 2018

E4

Kulumsa 2018

E12

5

VH-45-014-8/2/6

G5

Ghinchi 2018

E5

6

VSFH-180-013-10/12

G6

Kulumsa 2018

E6

7

Oissa

G7

Holetta 2019

E7

8

R/Black

G8

Adadi 2019

E8

2.2.2. Principal Component Analysis (PCA)
Principal component analysis was performed by taking into account each of the 11 traits in order to reduce a big number of variables into a small set and evaluate the pattern of variations. It helps to highlight the resolving power of the ordination and to reduce a large set of variables to a small set and to assess the pattern of variations. Only PCs with Eigen values larger than one were taken into consideration during analysis . To gain a comprehensive understanding of how individual variables contribute to the principal components in the dataset, the PCA results were analyzed through several key metrics, each providing different insights into the role of each variable. Squared cosine (var$cos2) values were calculated to measures the quality of representation of each variable on the corresponding principal components. For better interpreting how strongly each variable is associated with the principal components and to identify which variables contribute most to each component, the correlation coefficient between original variable and a principal component was analyzed using correlation (var$cor) metric . Contribution of each variable to the formation of each principal component were analyzed to identify most influential variables using contributions (var$contrib) metrics .
2.2.3. Correlation Analysis
In order to measure the direction and degree of relationships between various traits Pearson correlation analysis was performed and the significance of each correlation was tested. The degree of correlation is categorized as no correlation (0 to 0.1), weak correlation (0.1 to 0.39), moderate correlation (0.4 to 0.69), strong correlation (0.7 to 0.89) and very strong correlation (0.9 to 1) .
All statistical data analyses in this study were conducted using R software version 4.3.2 with relevant R packages to ensure accurate and comprehensive interpretation of the results.
3. Results and Discussion
3.1. Multivariate Analysis of Variance
The MANOVA results, presented in (Table 2), revealed that the effects of genotype, environment, and their interaction on the set of dependent variables were highly significant (p < 0.001). The significant effect of genotype indicates that different genetic variations have a notable impact on the multivariate response. Similarly, the significant effect of environment suggests that environmental conditions exert a strong influence on the dependent variables. Moreover, the significant interaction between genotype and environment indicates that the impact of genotype on the dependent variables varies with different environmental conditions. The statistical significance for an effect in MANOVA using Pillai’s trace, means that the centroids of the dependent variables are different for the different levels of the independent variable relative to the within variability . Overall, these findings show that both genotype and environment, as well as their interaction, significantly affect the dependent variables, with all effects being statistically significant at a very high level of confidence. In the context of genotype and environment interactions, ANOVA can be particularly useful for determining the significance of these factors and their interaction on a set of dependent variables. MANOVA and similar multivariate techniques are employed to assess the effects of genotype, environment, and their interaction on various dependent variables related to important traits. Several studies have reported highly significant MANOVA values for the effects of genotype, environment, and their interaction. These findings are consistent with previous studies that have observed significant effects of differences in physical attributes of the sunflower varieties . This result aligns with present observation that genotype influences the multivariate response. Mohammed Abu reported significant effect due to genotype, and genotype by environment interactions. Aboye and Mohammed also indicated significant effects of environment, genotype, and interactions on sunflower. The significant main effects of genotype and environment emphasize the importance of considering both genetic and environmental factors when studying multivariate responses. The present result suggest that breeding programs and environmental management strategies should account for the interaction between genotype and environment to optimize trait performance . This significant genetic variation indicates the potential for genetic improvement through selection and breeding programs.
3.2. Principal Component Analysis
Table 3 provides a comprehensive summary of the principal component loadings, eigenvalues, and explained variance percentages for the studied sunflower genotypes. The table illustrates how each principal component contributes to the total variance within the dataset, offering understanding into the underlying data structure.
Table 2. MANOVA Results for Genotype, Environment, and Their Interaction in Sunflower Genotypes Tested in the 2018 and 2019 Growing Seasons.

Effect

Df

Pillai’s Trace

Approx. F

Numerator df

Denominator df

Genotype

7

5.4121***

64.416

70

1323

Environment

11

7.3825***

49.23

110

1920

Genotype by Environment (Interaction)

77

9.3537***

36.088

770

1920

Residuals

95

22.1483

Note: Df= degree of freedom; *** = Statistical significance at (p < 0.001); Approx. F =approximate F-statistic for each effect; Numerator df = Degrees of Freedom for the Effect; Denominator df = Degrees of Freedom for Error/Residuals in the model.
The phenotypic variation captured by the PCA cannot be fully explained by just a few principal components. The first four components, each with an eigenvalue greater than 1, together account for 74.23% of the total variance. This finding is consistent with previous PCA research on sunflowers. Previous report on sunflower genotypes revealed that the first four principal components explained 76% of the variance , Arshad reported 74.53% variance by three components, Kholghi found 78%, and Lagiso observed 80.2%. While the variance explained by the first four components in this study is somewhat lower than some other studies, but it aligns with the general trend observed in PCA analyses of sunflower genotypes. This variations in explained variance may arise from differences in genotype numbers, environmental conditions, and seasonal variations across test locations. Principal components 1 and 2 account 29.5% and 22% of the total variance, respectively (Figure 1). For each principal component, traits with the highest absolute loadings are most strongly associated with that component. The loadings reveal that variables such as OYLD, YELDK, and PH have the most significant contributions to Principal component 1. On the other hand, DM, PM and Bli contribute significantly to principal component 2. This indicates that these variables are particularly influential in differentiating sunflower genotypes across the two years. The explained variance percentages further emphasize the importance of each principal component in capturing dataset variation. The study highlighted key traits that contribute to the overall variation in sunflower genotypes are YELDK, OYLD, DM, PH, and PM. Figures 1 and 2 illustrate the impact and distribution of these traits in the analysis, underscoring their significance in understanding sunflower genotypes performance and variability.
In the PCA plot, traits such as YELDK, OYLD and PH have long vectors, cluster closely together with small angles between them. This clustering suggests that these traits are positively correlated and collectively influence principal component 1. The long vectors indicate that these traits significantly impact overall variability, making them crucial targets for sunflower breeding programs focused on improving yield and plant height. In contrast, TSW has a shorter vector but is clustered near YELDK, OYLD, and PH. Despite its shorter vector, TSW's proximity to yield traits suggests a positive association, though its influence is less pronounced. On the other hand, traits influencing Principal component 2, such as PM, Bli, and FD, exhibit wider vector angles and are more spread out. This wide angle suggests that these traits are less correlated with each other and contribute to different aspects of the variation captured by principal component 2. The positive and negative values of these traits along principal components 1 and 2 imply that while yield traits are aligned in one direction, disease resistance traits and flowering time influence variation in a different direction. This divergence suggests that selecting for high yielder sunflower genotypes could be at odds with improving disease resistance and maturity time highlighting the need for a balanced approach in breeding strategies that aim to optimize both productivity and resilience. Finding a small number of linear combinations that mostly explain the variation in the data under study is the aim of principal component analysis. Both the identification of potential groups and the representation of individual differences can be accomplished with PCA .
Table 3. Summary of principal component loadings, eigenvalues, and explained variance percentages for sunflower genotypes tested in the 2018 and 2019 growing seasons.

Variables

PC1

PC2

PC3

PC4

PC5

PC6

PC7

PC8

PC9

PC10

PC11

PM

-0.11

0.50

0.19

0.11

0.26

-0.05

0.21

0.48

-0.59

0.00

0.00

Bli

0.05

0.42

0.43

0.12

0.10

0.12

0.36

-0.67

0.13

0.00

0.00

FD

-0.21

0.36

-0.51

-0.27

0.12

0.12

0.26

0.09

0.34

-0.01

-0.52

DM

-0.39

0.35

-0.20

-0.08

-0.38

-0.02

0.06

0.05

0.19

-0.01

0.70

GFP

-0.34

0.11

0.25

0.18

-0.69

-0.15

-0.20

-0.02

-0.10

-0.01

-0.48

PH

-0.35

-0.25

-0.29

-0.31

0.01

-0.07

0.17

-0.47

-0.62

-0.01

0.00

YELDK

-0.45

-0.22

0.23

0.03

0.15

0.45

0.01

0.10

0.09

0.68

0.00

TSW

-0.19

-0.19

0.42

-0.47

0.11

-0.61

0.27

0.16

0.25

0.01

0.00

HD

-0.07

-0.32

-0.20

0.63

-0.08

-0.18

0.63

0.09

0.08

-0.01

0.00

oil

-0.30

0.16

-0.18

0.37

0.43

-0.49

-0.45

-0.22

0.09

0.17

0.00

OYLD

-0.47

-0.18

0.19

0.10

0.26

0.30

-0.10

0.05

0.12

-0.72

0.00

Eigenvalue

3.25

2.42

1.42

1.07

0.92

0.65

0.54

0.41

0.31

0.00

0.00

Variance percent

29.50

22.00

13.00

9.73

8.32

5.94

4.91

3.72

2.85

0.03

0.00

Cumulative variance percent

29.51

51.55

64.50

74.23

82.55

88.49

93.40

97.13

99.97

100.00

100.00

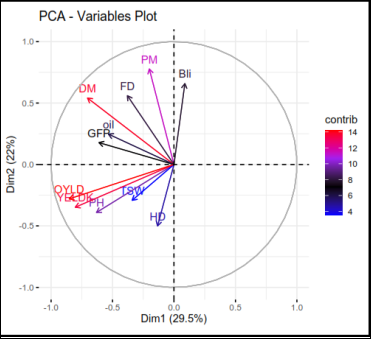
Figure 1. Variable Loadings and Contributions to Principal Components 1 and 2 for Sunflower Genotypes Tested in 2018 and 2019.
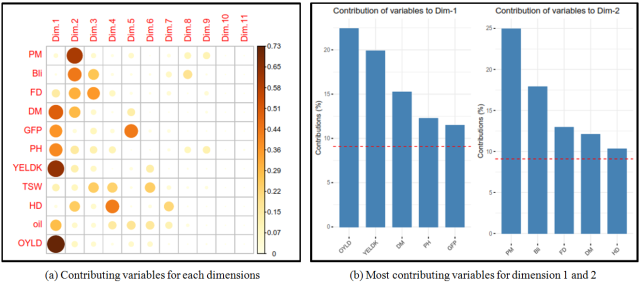
Figure 2. The most Contributing variables for each dimensions (principal components) of sunflower genotypes tested in 2018 and 2019.
3.3. Correlation Analysis
The correlation heatmap of sunflower traits provides a comprehensive view of the relationships among various traits (Figure 3), The correlation values are categorized into five levels: no correlation (0 to 0.1), weak correlation (0.1 to 0.39), moderate correlation (0.4 to 0.69), strong correlation (0.7 to 0.89), and very strong correlation (0.9 to 1). Only significant correlations are visible in the heatmap. The OYLD and YELDK exhibit a very strong correlation of 0.974. This indicates a nearly perfect positive relationship, suggesting that improvements in oil yield are strongly associated with higher seed yields. This strong correlation implies that focusing on enhancing oil yield could substantially increase seed yield, which is crucial for improving overall sunflower production. The strong correlation observed between YELDK and OYLD aligns with their close clustering in the PCA plot, as shown in Figure 1. This close association suggests that YELDK and OYLD contribute similarly to the principal components, highlighting their significant interrelationship and importance as key traits. Correlation analysis in sunflower has reported a very strong positive relationship between OYLD and YELDK . Other report by Tyagi showed that traits like days to 50% flowering, days to maturity, plant height, head diameter and oil content showed highly significant positive correlations with seed yield and oil content in sunflower. This suggest that sunflower breeding programs should prioritize traits that positively influence both oil yield and seed yield to maximize productivity. The MD and GFP show a strong correlation of 0.666. This indicates that longer grain filling periods are associated with longer maturity periods. This relationship highlights the potential for selecting varieties with extended grain filling periods to potentially influence the maturity time, which could be important for optimizing growing conditions and harvest timing. Additionally, FD and MD have a strong correlation of 0.728, suggesting that later flowering is strongly associated with later maturity. This implies that flowering time could be a significant factor in determining the maturity period. Understanding the strong correlation between phonological traits relationship can help in selecting varieties with optimal maturity periods for specific growing conditions. These strong correlations are consistent with the patterns observed in the PCA, where FD, DM, and GFP clustered closely in PC2 (Figure 1). The small angle between DM and GFP in PCA supports the observed strong correlations, confirming their significant interrelationship. Similarly, the strong correlation between FD and MD is consistent with their close clustering in PCA, underscoring the interconnected nature of these traits.
Studies have shown that a longer GFP is often associated with a longer MD, which can impact the overall yield potential of sunflower varieties, selecting for longer GFP can lead to delayed maturity but potentially higher yields due to prolonged grain development. According to Dhillon report, seed filling duration has been found to have a highly significant positive correlation with seed yield in sunflower Which indicates that a longer GFP is associated with higher yields in sunflower. While there is evidence of a positive relationship between GFP and yield in sunflower, the direct correlation between DM and GFP is not consistently reported across studies. Factors such as genotype, environmental conditions, and specific growth stages considered can influence these relationships . But PH and YELDK exhibit a moderate correlation of 0.491. This suggests that taller plants are somewhat associated with higher seed yields. Such a correlation could be useful for breeding programs aiming to increase seed yield by selecting for greater plant height. Furthermore, PH and GFP show a moderate positive correlation of 0.160, indicating a slight relationship between plant height and the length of the grain filling period. This may be less influential but could still be relevant in the broader context of trait selection. The moderate correlation between PH and YELDK highlights the potential of using plant height as a selection criterion for increasing seed yield. Additionally, although less influential, the relationship between PH and GFP may provide additional understandings for breeding programs focused on optimizing plant growth and development.
Table 4. Correlation Analysis of 11 Sunflower Traits from the 2018 and 2019 Growing Seasons.

Traits

PM

Bli

FD

DM

GFP

PH

YELDK

TSW

HD

oil

OYLD

PM

1

Bli

0.538***

1

FD

0.353***

0.052 ns

1

DM

0.393***

0.126 ns

0.728***

1

GFP

0.188ns

0.127 ns

-0.028ns

0.666***

1

PH

-0.252*

-0.402***

0.258*

0.302**

0.160 ns

1

YELDK

-0.019 ns

-0.133 ns

0.005 ns

0.262**

0.377 **

0.491***

1

TSW

-0.041ns

-0.043 ns

-0.162 ns

-0.005 ns

0.169 ns

0.290**

0.347***

1

HD

-0.293**

-0.323 **

-0.202 ns

-0.123 ns

0.040 ns

0.197 ns

0.190 ns

-0.082 ns

1

oil

0.305**

0.030 ns

0.317 ns

0.377**

0.205 *

0.201*

0.200 ns

-0.013 ns

0.119 ns

1

OYLD

0.047ns

-0.112 ns

0.050*

0.298**

0.380***

0.485***

0.974***

0.340***

0.194 ns

0.403***

1

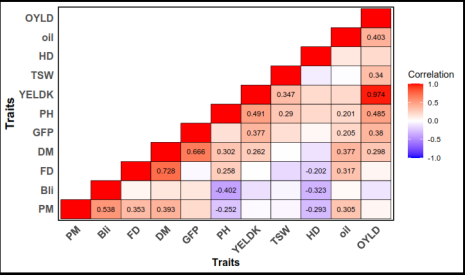
Figure 3. The correlation matrix heatmap of 11 sunflower traits evaluated in the 2018 and 2019 growing seasons.
4. Conclusion
The MANOVA results indicate significant effects of genotype, environment, and their interaction on sunflower traits, underscoring the importance of considering genotype-by-environment interactions for optimizing trait expression. To enhance sunflower varieties, future research should focus on selecting genotypes that perform consistently across diverse environments and exploring these interactions in greater depth. The PCA analysis reveals that the first four principal components account for 74.23% of the total variation, emphasizing key traits such as YELDK, OYLD, DM, PH, and GFP. These traits are crucial for understanding sunflower performance. Correlation analysis further highlights a strong relationship between OYLD and YELDK, suggesting that improvements in both should be pursued concurrently. Additionally, the correlation between DM and GFP indicates that extending the GFP could positively impact maturity timing and yield. To enhance sunflower varieties, future research should prioritize selecting genotypes that perform consistently across diverse environments. Focus on improving key traits, including seed yield and oil yield, which are strongly correlated. Additionally, prolonging the GFP based on environmental condition can positively impact maturity time and yield. A comprehensive breeding approach should not only prioritize these yield-related traits but also incorporate resistance to diseases like powdery mildew and blight, and optimize days to flowering. This balanced strategy will enhance the robustness and productivity of sunflower varieties, leading to more effective and sustainable breeding outcomes.
Abbreviations

PM

Powdery Mildew

Bli

Blight

FD

50% Days to Flowering

MD

50% Days to Maturity

GFP

Grain Filling Period

PH

Plant Height

HD

Head Diameter

YELDK

Seed Yield Per Hectare

TSW

Thousand Seed Weight

OC

Oil Content in Percent

OYLD

Oil Yield Per Hectare

Acknowledgments
The authors thank Ethiopian Institute of Agricultural Research for financial support and the High and Midland Oilseeds Research Program staff members for their tremendous effort in trial management and data collection.
Author Contributions
Birhanu Mengistu: Conceptualization, Formal Analysis, Project administration, Software, Supervision, Visualization, Writing – original draft, Writing – review & editing
Tilahun Mola: Data curation, Supervision, Writing – review & editing
Funding
This experiment was supported by Ethiopian Institute of Agricultural Research.
Data Availability Statement
The data is available from the corresponding author upon reasonable request.
Conflicts of Interest
The authors declare no conflicts of interest.
References
[1] Meena HP, Sujatha M. Sunflower breeding. In Fundamentals of field crop breeding 2022 May 6 (pp. 971-1008). Singapore: Springer Nature Singapore.
[2] Rauf S. Breeding strategies for sunflower (Helianthus annuus L.) genetic improvement. Advances in Plant Breeding Strategies: Industrial and Food Crops: Volume 6. 2019: 637-73.
[3] Rencher AC. WF (2012): Methods of Multivariate Analysis.
[4] St, L., & Wold, S. (1990). Multivariate analysis of variance (MANOVA). Chemometrics and Intelligent Laboratory Systems, volume 9: 2, 1991: 127-141.
[5] Hair JF, Anderson RE, Tatham RL, Black WC. Multivariate data analysis prentice hall. Upper Saddle River, NJ. 1998; 730.
[6] Piedade, Gabriela N. da, Lucas V. Vieira, Amanda RP dos Santos, Deoclecio J. Amorim, Maurício D. Zanotto, and Maria MP Sartori. "Principal component analysis for identification of superior castor bean hybrids." Journal of agricultural science 11, no. 9 (2019): 179.
[7] Roger MR, Robert NC, Anne MH. Statistical methods in agriculture and experimental biology. Texts in Statistical Science) CRC Press. 2003.
[8] Sujatha K, Nadaf HL. Correlation for yield and yield related trait in mutant and segregating genotypes in sunflower (Helianthus annus L.). Molecular Plant Breeding. 2013 Oct 11; 4.
[9] Lagiso TM, Singh BC, Weyessa B. Evaluation of sunflower (Helianthus annuus L.) genotypes for quantitative traits and character association of seed yield and yield components at Oromia region, Ethiopia. Euphytica. 2021 Feb; 217(2): 27.
[10] Jolliffe IT. Principal Component Analysis for Special Types of Data. In: Principal Component Analysis. Springer Series in Statistics. Springer, New York; 2002.
[11] Rani, R., Sheoran, R. K. and Chander, S. Association analysis for yield and component traits in sunflower (Helianthus annuus L.). Journal of Oilseeds Research, 33(3), 2016 201-204.
[12] Munaiza Baloch, Majid Hussain Kaleri, Abdul Wahid Baloch, Tarique Ahmed Baloch, Naila Gandahi, Qamaruddin Jogi, Liaquat Ali Bhutto and Jaleel Ahmed Hakro. Phenotypic correlation and heritability analysis in sunflower (Helianthus annuus L.) germplasm. Pure and Applied Biology. 2016; Vol. 5, Issue 3, pp641-646.
[13] Tabachnick BG, Fidell LS, Ullman JB. Using multivariate statistics. Boston, MA: Pearson; 2013 Jul.
[14] Johnson, Richard Arnold, and Dean W. Wichern. "Applied multivariate statistical analysis." (2002).
[15] Abdi H, Williams LJ. Principal component analysis. Wiley interdisciplinary reviews: computational statistics. 2010 Jul; 2(4): 433-59.
[16] Gabriel KR. The biplot graphic display of matrices with application to principal component analysis. Biometrika. 1971 Dec 1; 58(3): 453-67.
[17] Schober P, Boer C, Schwarte LA. Correlation coefficients: appropriate use and interpretation. Anesthesia & analgesia. 2018 May 1; 126(5): 1763-8.
[18] R Core Team. A language and environment for statistical computing. Version 4.3. 2. R Foundation for Statistical Computing, Vienna (2023).
[19] Frey BB, editor. The SAGE encyclopedia of educational research, measurement, and evaluation. Sage publications; 2018 Jan 29.
[20] Çetin N, Karaman K, Beyzi E, Sağlam C, Demirel B. Comparative evaluation of some quality characteristics of sunflower oilseeds (Helianthus annuus L.) through machine learning classifiers. Food Analytical Methods. 2021 Aug; 14: 1666-81.
[21] Mohammed Abu. Genotype by Environment Interaction and Stability Analysis in Sunflower Genotypes. Cell Biology. Vol. 11, No. 1, 2023, pp. 8-11.
[22] Aboye BM, Edo MA. Exploring genotype by environment interaction in sunflower using genotype plus genotype by environment interaction (GGE) and best linear unbiased prediction (BLUP) approaches. Discover Applied Sciences. 2024 Aug 5; 6(8): 431.
[23] Slafer GA, Kantolic AG, Appendino ML, Tranquilli G, Miralles DJ, Savin R. Genetic and environmental effects on crop development determining adaptation and yield. InCrop physiology 2015 Jan 1 (pp. 285-319). Academic Press.
[24] Arshad M, Khan MA, Jadoon SA, Mohmand AS. Factor analysis in sunflower (Helianthus annuus L.) to investigate desirable hybrids. Pak. J. Bot. 2010 Dec 1; 42(6): 4393-402.
[25] Kholghi M, Bernousi I, Darvishzadeh R, Pirzad A. Correlation and path-cofficient analysis of seed yield and yield related trait in Iranian confectionery sunflower populations. African Journal of Biotechnology. 2011; 10(61): 13058-63.
[26] Shlens J. A tutorial on principal component analysis. arXiv preprint arXiv: 1404.1100. 2014 Apr 3.
[27] Pandya MM, Patel PB, Narwade AV. A study on correlation and path analysis for seed yield and yield components in Sun flower [Helianthus annuus (L.)]. Electronic Journal of Plant Breeding. 2016; 7(1): 177-83.
[28] Tyagi V, Dhillon SK, Bajaj RK, Kaur J. Divergence and association studies in sunflower (Helianthus annuus L.). Helia. 2013 Jul 1; 36(58): 77-94.
[29] Dhillon BS, Sharma PK, Kingra PK. Agronomic measures to improve thermal energy utilization by spring sunflower (Helianthus annuus L.) BUTA. Journal of Agrometeorology. 2017 Mar 1; 19(1): 34-8.
[30] Pfeiffer TW, Egli DB. Heritability of seed-filling period estimates in soybean. Crop science. 1988 Nov; 28(6): 921-5.
Cite This Article
  • APA Style

    Aboye, B. M., Tesema, T. M. (2024). Analyzing Sunflower Trait Patterns Using MANOVA, PCA, and Correlation Across Seasons and Locations. American Journal of Biological and Environmental Statistics, 10(3), 87-95. https://doi.org/10.11648/j.ajbes.20241003.16

    Copy | Download

    ACS Style

    Aboye, B. M.; Tesema, T. M. Analyzing Sunflower Trait Patterns Using MANOVA, PCA, and Correlation Across Seasons and Locations. Am. J. Biol. Environ. Stat. 2024, 10(3), 87-95. doi: 10.11648/j.ajbes.20241003.16

    Copy | Download

    AMA Style

    Aboye BM, Tesema TM. Analyzing Sunflower Trait Patterns Using MANOVA, PCA, and Correlation Across Seasons and Locations. Am J Biol Environ Stat. 2024;10(3):87-95. doi: 10.11648/j.ajbes.20241003.16

    Copy | Download

  • @article{10.11648/j.ajbes.20241003.16,
      author = {Birhanu Mengistu Aboye and Tilahun Mola Tesema},
      title = {Analyzing Sunflower Trait Patterns Using MANOVA, PCA, and Correlation Across Seasons and Locations
    },
      journal = {American Journal of Biological and Environmental Statistics},
      volume = {10},
      number = {3},
      pages = {87-95},
      doi = {10.11648/j.ajbes.20241003.16},
      url = {https://doi.org/10.11648/j.ajbes.20241003.16},
      eprint = {https://article.sciencepublishinggroup.com/pdf/10.11648.j.ajbes.20241003.16},
      abstract = {Sunflower is an important agricultural crop valued for its high oil yield, versatility in culinary and industrial applications and adaptability to diverse environments. Eight advanced sunflower genotypes were tested in a randomized complete block design (RCBD) with three replications at six locations over the 2018 and 2019 seasons. The study aimed to evaluate the effects of environmental and genotypic variations using MANOVA, PCA, and correlation analysis to discover trait patterns and relationships. The MANOVA results revealed highly significant effects of genotype, environment, and their interaction on the 11 dependent variables (p < 0.001). The four principal components account for 74.23% of the total variation, with key traits such as seed yield per hectare, oil yield per hectare, days to maturity, plant height, and grain filling period significantly contributing to the overall variability. Oil yield per hectare and seed yield per hectare exhibited a very strong association (0.974). Days to maturity (DM) and grain filling period (GFP) showed a strong correlation (0.666), suggesting that longer grain filling periods may enhance both maturity and yield. Additionally, plant height (PH) and seed yield per hectare (YELDK) had a moderate correlation (0.491). Breeding programs should target traits with strong correlations to boost sunflower productivity and adaptability. Future research should prioritize selecting genotypes that perform well across diverse environments, focusing on seed yield, oil yield, and traits such as maturity and grain filling period. Additionally, breeding should incorporate disease resistance and optimize days to flowering to develop more robust and productive sunflower varieties.
    },
     year = {2024}
    }
    

    Copy | Download

  • TY  - JOUR
    T1  - Analyzing Sunflower Trait Patterns Using MANOVA, PCA, and Correlation Across Seasons and Locations
    
    AU  - Birhanu Mengistu Aboye
    AU  - Tilahun Mola Tesema
    Y1  - 2024/09/29
    PY  - 2024
    N1  - https://doi.org/10.11648/j.ajbes.20241003.16
    DO  - 10.11648/j.ajbes.20241003.16
    T2  - American Journal of Biological and Environmental Statistics
    JF  - American Journal of Biological and Environmental Statistics
    JO  - American Journal of Biological and Environmental Statistics
    SP  - 87
    EP  - 95
    PB  - Science Publishing Group
    SN  - 2471-979X
    UR  - https://doi.org/10.11648/j.ajbes.20241003.16
    AB  - Sunflower is an important agricultural crop valued for its high oil yield, versatility in culinary and industrial applications and adaptability to diverse environments. Eight advanced sunflower genotypes were tested in a randomized complete block design (RCBD) with three replications at six locations over the 2018 and 2019 seasons. The study aimed to evaluate the effects of environmental and genotypic variations using MANOVA, PCA, and correlation analysis to discover trait patterns and relationships. The MANOVA results revealed highly significant effects of genotype, environment, and their interaction on the 11 dependent variables (p < 0.001). The four principal components account for 74.23% of the total variation, with key traits such as seed yield per hectare, oil yield per hectare, days to maturity, plant height, and grain filling period significantly contributing to the overall variability. Oil yield per hectare and seed yield per hectare exhibited a very strong association (0.974). Days to maturity (DM) and grain filling period (GFP) showed a strong correlation (0.666), suggesting that longer grain filling periods may enhance both maturity and yield. Additionally, plant height (PH) and seed yield per hectare (YELDK) had a moderate correlation (0.491). Breeding programs should target traits with strong correlations to boost sunflower productivity and adaptability. Future research should prioritize selecting genotypes that perform well across diverse environments, focusing on seed yield, oil yield, and traits such as maturity and grain filling period. Additionally, breeding should incorporate disease resistance and optimize days to flowering to develop more robust and productive sunflower varieties.
    
    VL  - 10
    IS  - 3
    ER  - 

    Copy | Download

Author Information